Free Access
Fig. 26
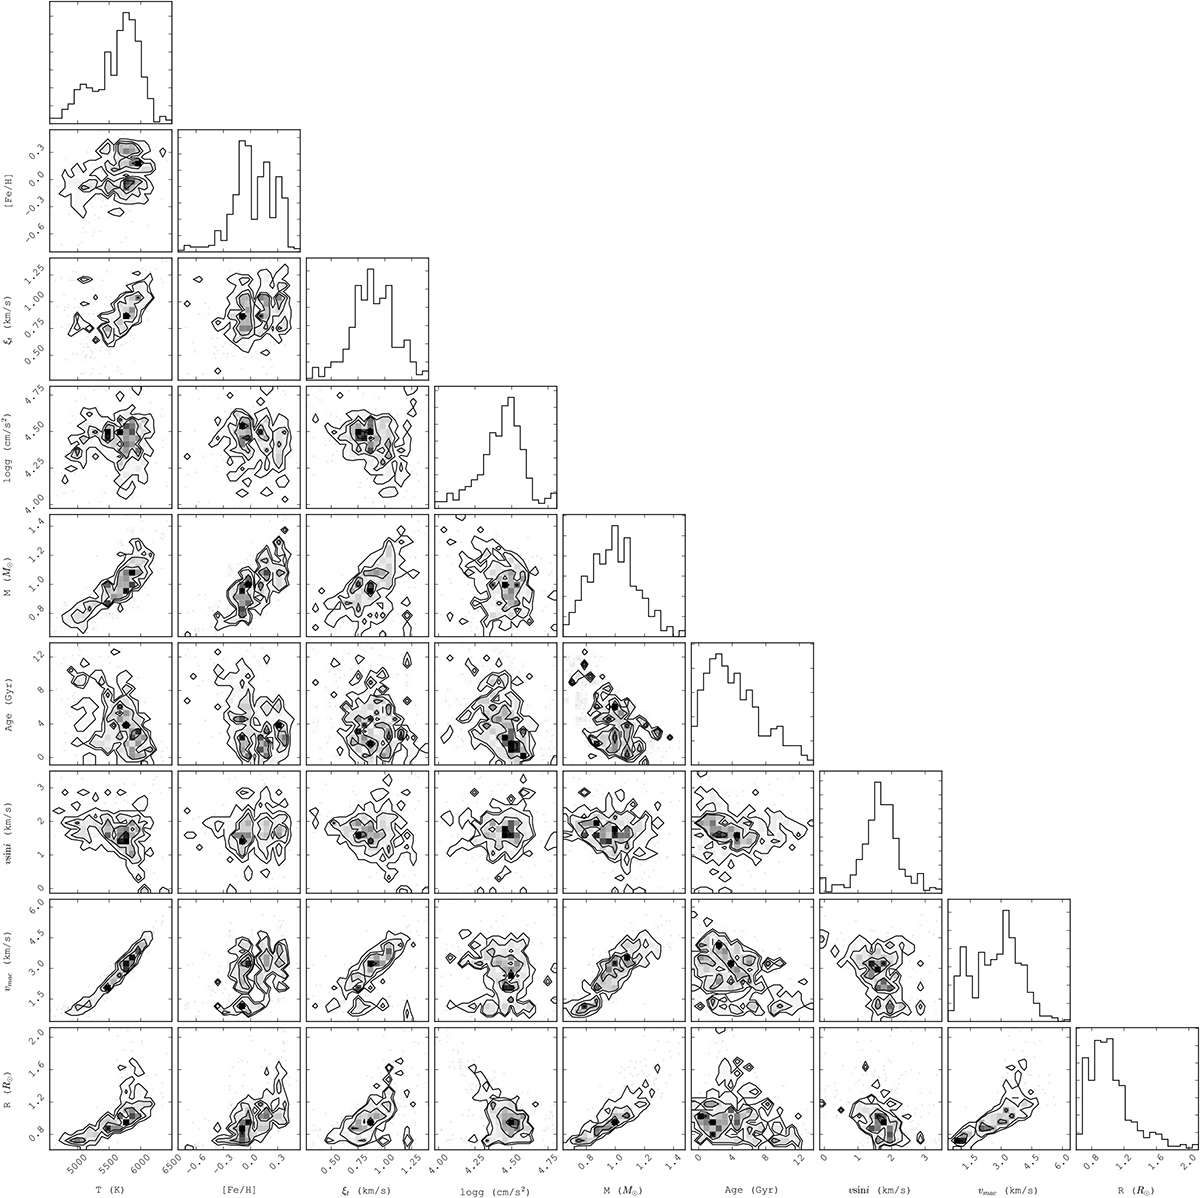
Correlation between the atmospheric parameters, as well as the mass and age for each stars, derived by this code for HARPS spectra. The histograms the top of each column show the distribution of every single quantity. For log g, ξt, and age, the points farther than 3σ from the mean of the distribution were not included.
Current usage metrics show cumulative count of Article Views (full-text article views including HTML views, PDF and ePub downloads, according to the available data) and Abstracts Views on Vision4Press platform.
Data correspond to usage on the plateform after 2015. The current usage metrics is available 48-96 hours after online publication and is updated daily on week days.
Initial download of the metrics may take a while.