Free Access
Fig. 21
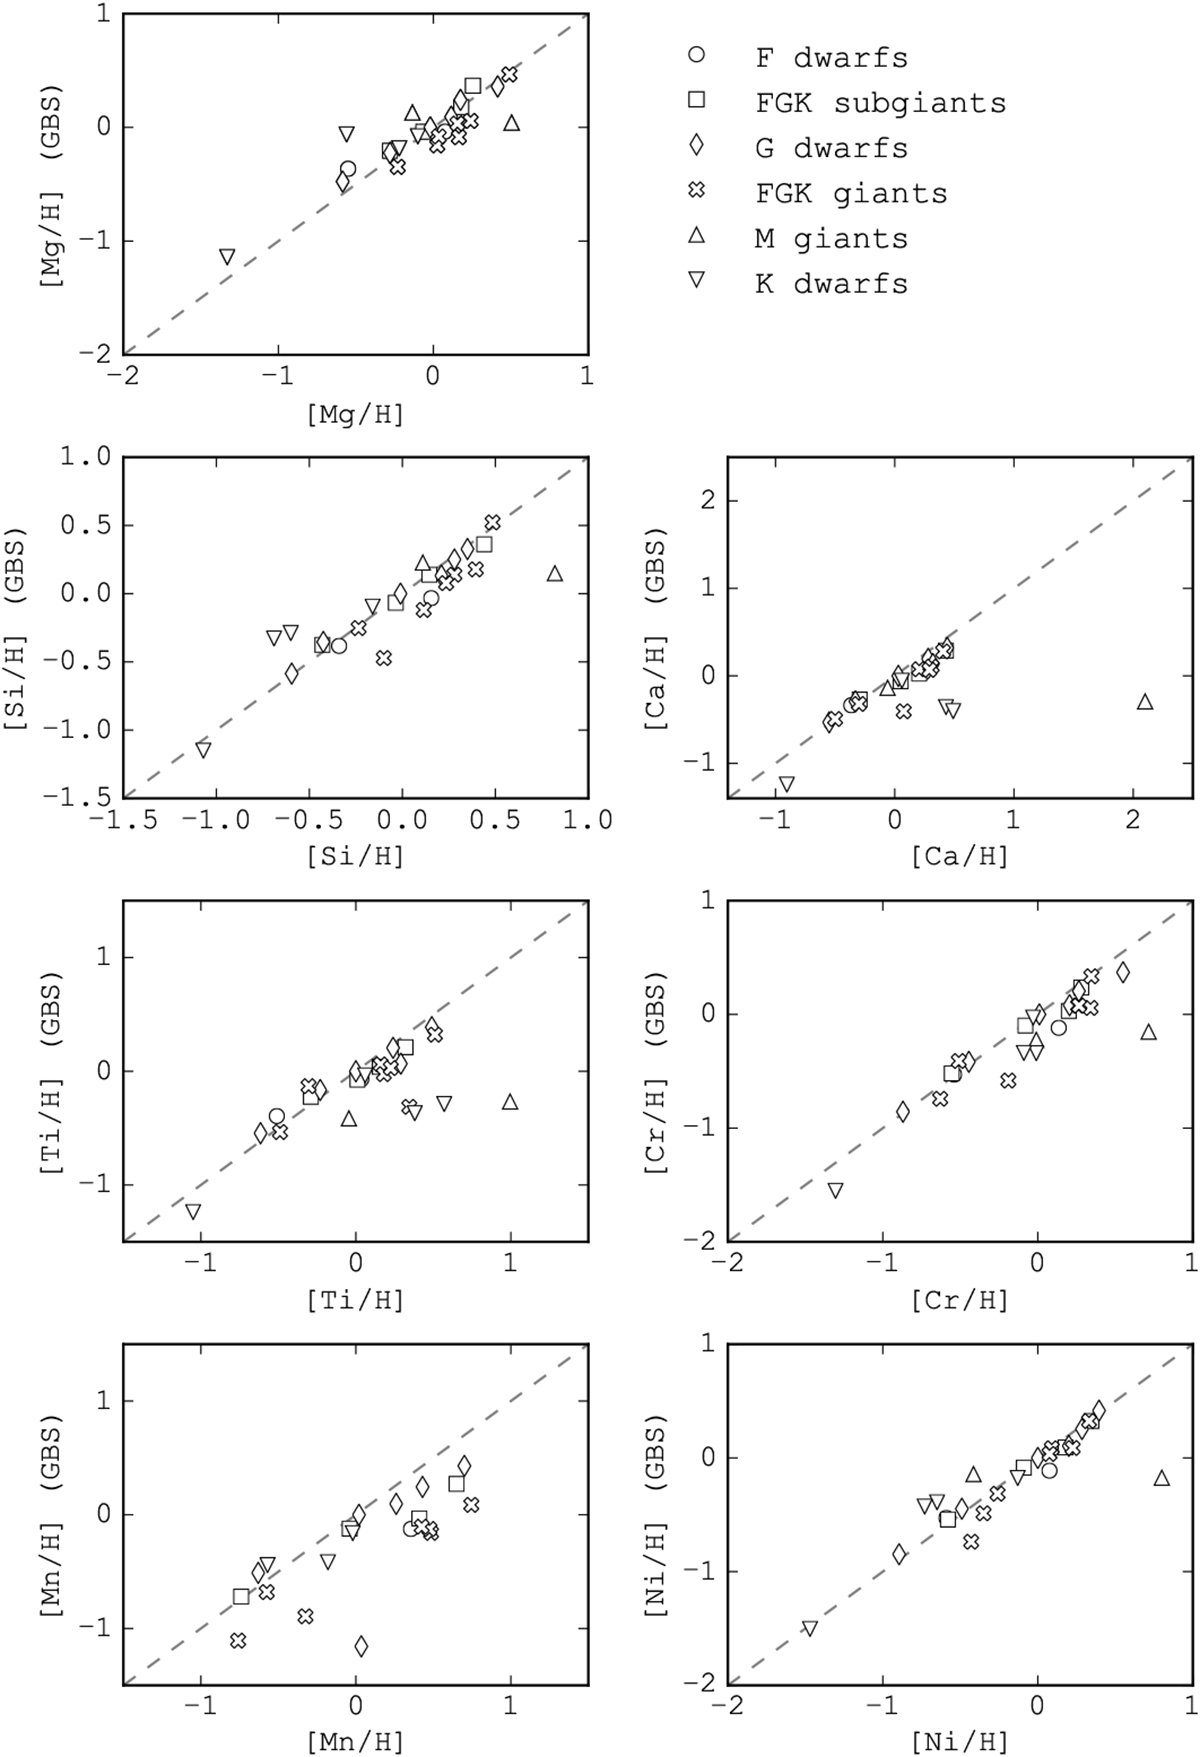
Results for the chemical abundance of α and iron peak elements, obtained with SPECIES (x-axis), compared with what was found in the literature (y-axis), for the GBS sample. The different symbols denote different spectral types. The dashed line represents the 1:1 relation.
Current usage metrics show cumulative count of Article Views (full-text article views including HTML views, PDF and ePub downloads, according to the available data) and Abstracts Views on Vision4Press platform.
Data correspond to usage on the plateform after 2015. The current usage metrics is available 48-96 hours after online publication and is updated daily on week days.
Initial download of the metrics may take a while.