Fig. 15
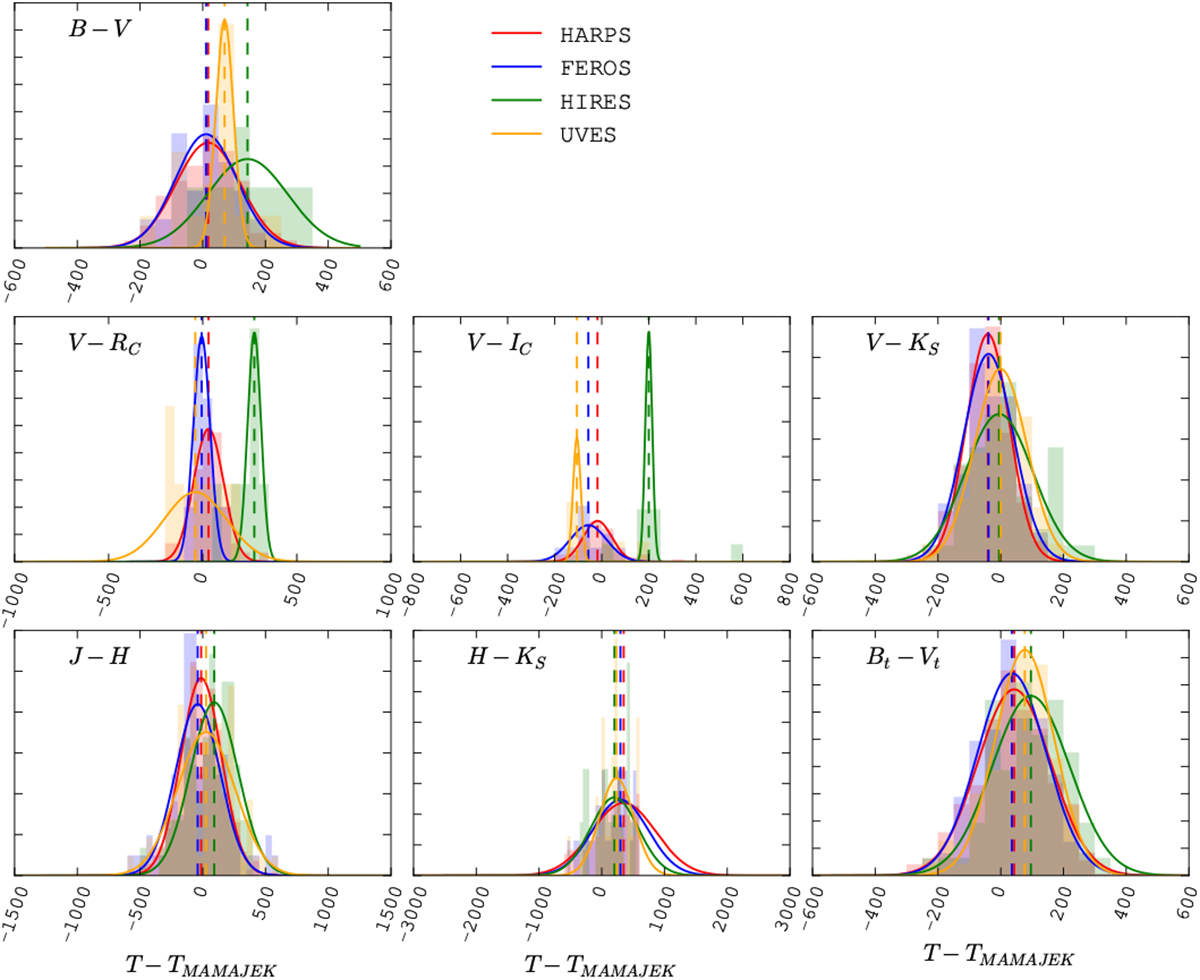
Histograms of the difference between the temperature computed by SPECIES, and those obtained by interpolating through the models of P13. The lines correspond to Gaussian distributions adjusted to the histograms, with mean values listed in Table 4. The mean of each Gaussian distribution is listed in Table 6. The colours represent the same instruments as in Fig. 13.
Current usage metrics show cumulative count of Article Views (full-text article views including HTML views, PDF and ePub downloads, according to the available data) and Abstracts Views on Vision4Press platform.
Data correspond to usage on the plateform after 2015. The current usage metrics is available 48-96 hours after online publication and is updated daily on week days.
Initial download of the metrics may take a while.