Fig. 12
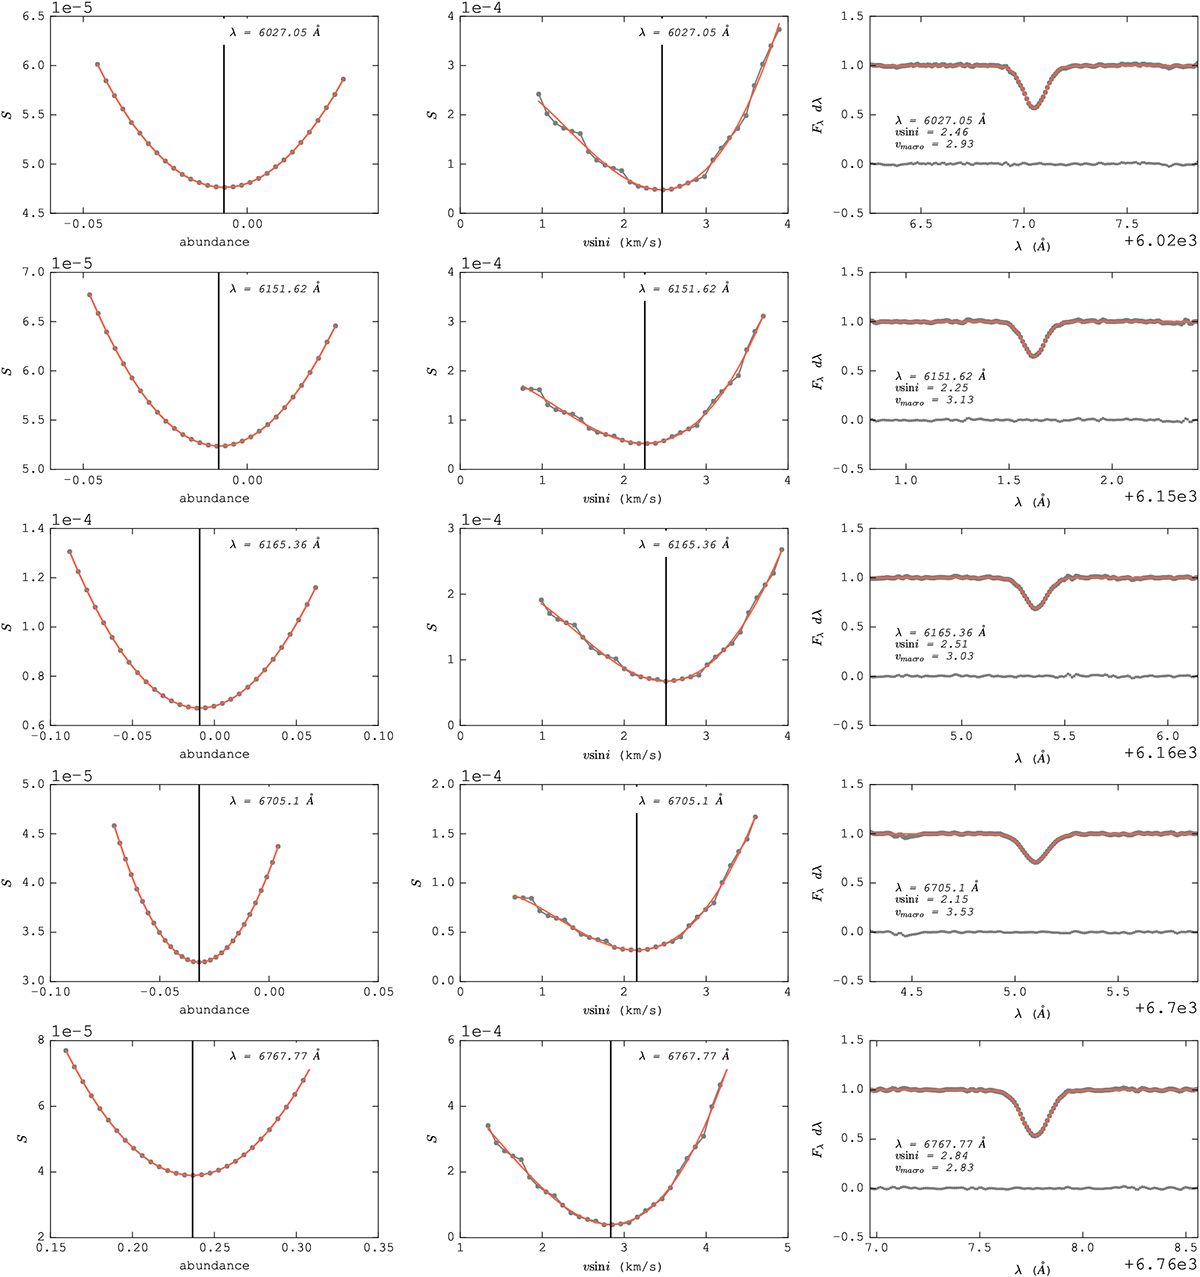
Change of S versus abundance (left panels) and rotational velocity (middle panels), for each line of the solar spectra. The red lines represent the cubic spline fit performed over the data, and the vertical line shows the values where the minimum of S is reached. Right panels: line profiles, along with the final fit (red line) combining the instrumental profile, macroturbulence and rotational velocity. The horizontal black line around zero represents the residuals of the fit.
Current usage metrics show cumulative count of Article Views (full-text article views including HTML views, PDF and ePub downloads, according to the available data) and Abstracts Views on Vision4Press platform.
Data correspond to usage on the plateform after 2015. The current usage metrics is available 48-96 hours after online publication and is updated daily on week days.
Initial download of the metrics may take a while.