Fig. 11
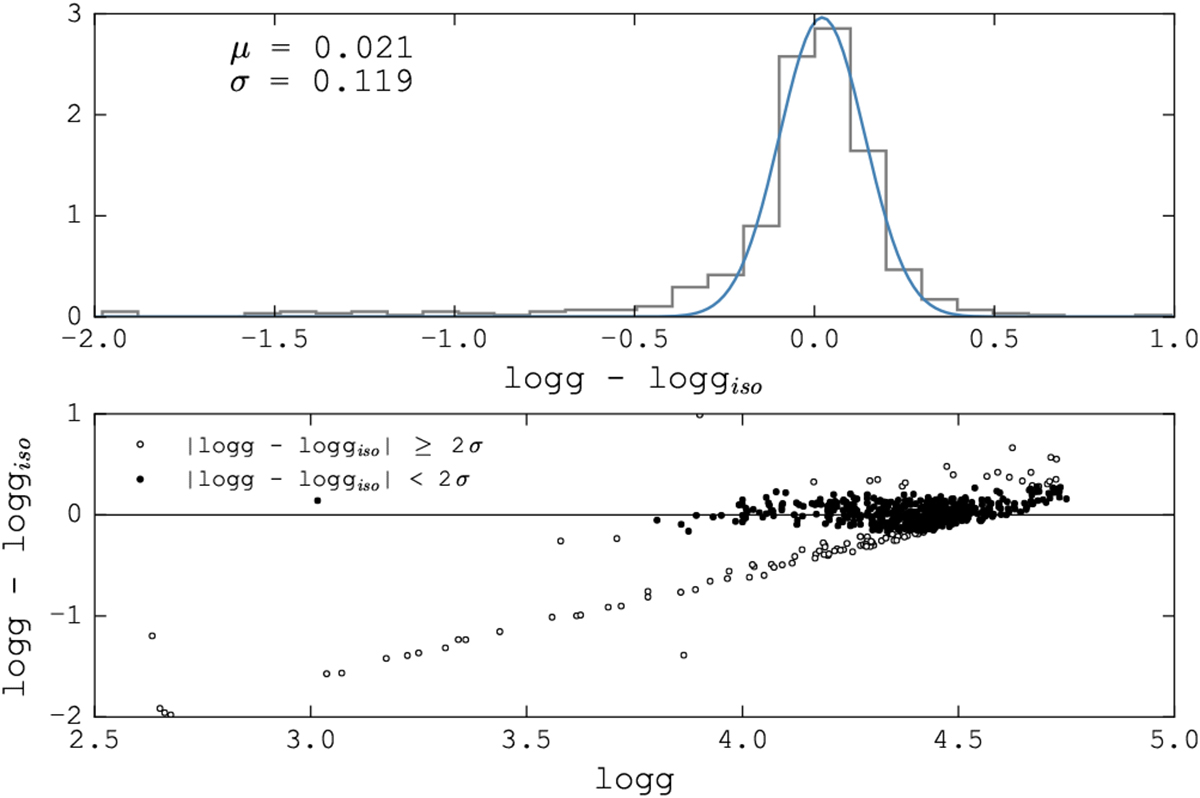
Top panel: histogram of the difference between logg and log giso. The blue line corresponds to the Gaussian distribution fit performed, with mean and sigma equal to μ = −0.004 and σ = 0.112, respectively. Bottom panel: difference between logg and log giso vs log g. Filled circlesare the stars laying within 2σ of the Gaussian fit performed to the histogram. Empty circles are the points laying beyond the 2σ level, for which the computation was performed a second time, but setting log g = log giso.
Current usage metrics show cumulative count of Article Views (full-text article views including HTML views, PDF and ePub downloads, according to the available data) and Abstracts Views on Vision4Press platform.
Data correspond to usage on the plateform after 2015. The current usage metrics is available 48-96 hours after online publication and is updated daily on week days.
Initial download of the metrics may take a while.