Fig. 10
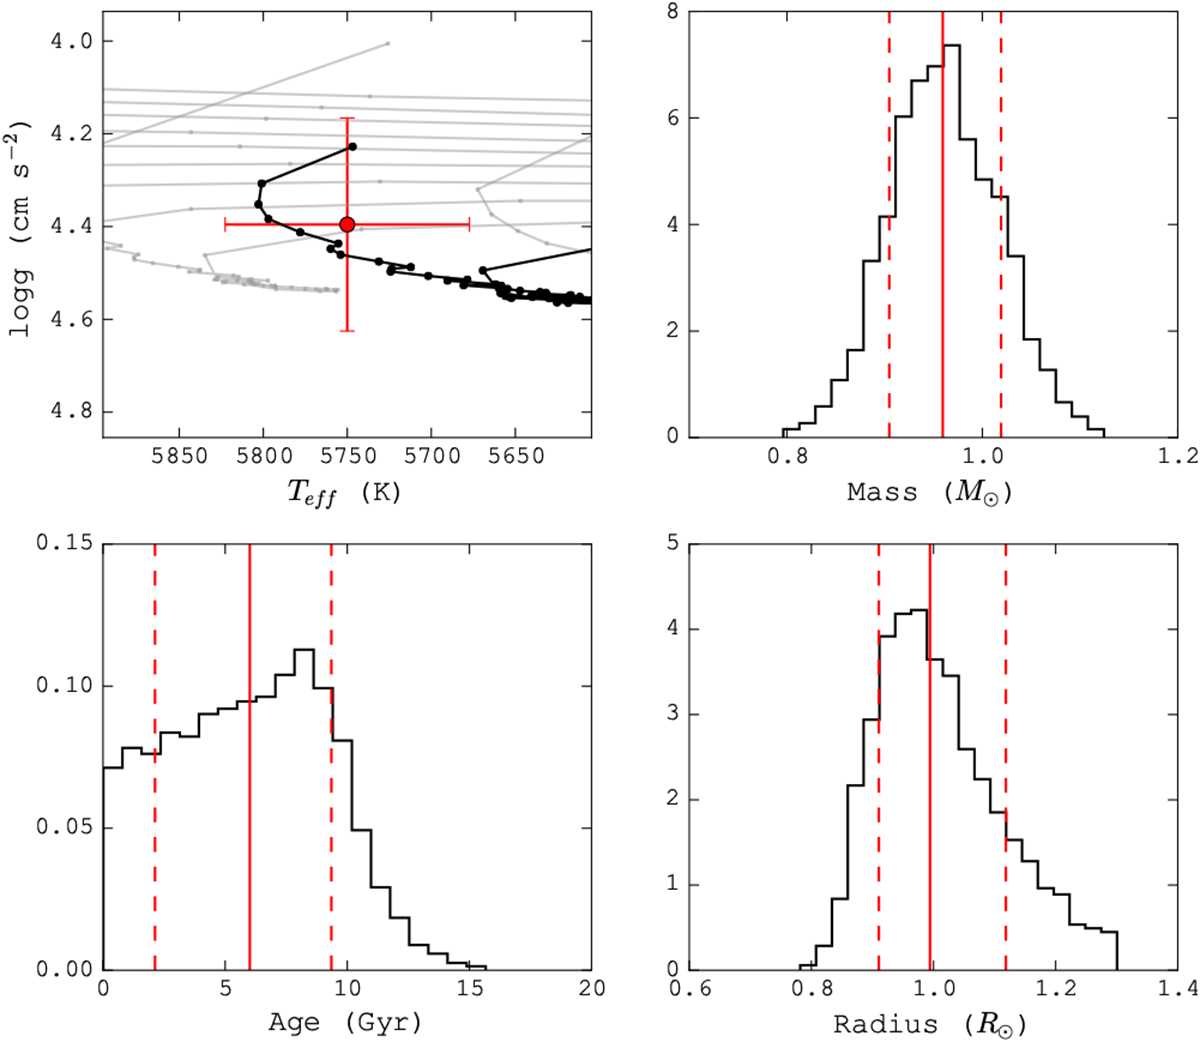
Results obtained for one of the solar spectrum used in SPECIES. First panel: log g –Teff space diagram. The red point represents the position of the Sun, with the final values obtained using our code (T = 5776 ± 73 K, [Fe/H] = 0.0± 0.1 dex, logg = 4.5 ± 0.2 cm s−2). Dotted lines represent the evolutionary tracks for stars with masses from 0.5 to 1.5 M⊙, and [Fe/H] = 0.0. The black line is the track for a 1.0 M⊙ star. Each point in the lines represent a different age. Remaining panels: distribution of the mass, age, and radius, for one of our HARPS solar spectra. The red dashed-solid-dashed lines represent the (16, 50, 84) quantiles, respectively. The results for this spectrum are listed in Table 3 as sun03.
Current usage metrics show cumulative count of Article Views (full-text article views including HTML views, PDF and ePub downloads, according to the available data) and Abstracts Views on Vision4Press platform.
Data correspond to usage on the plateform after 2015. The current usage metrics is available 48-96 hours after online publication and is updated daily on week days.
Initial download of the metrics may take a while.