Fig. B.1
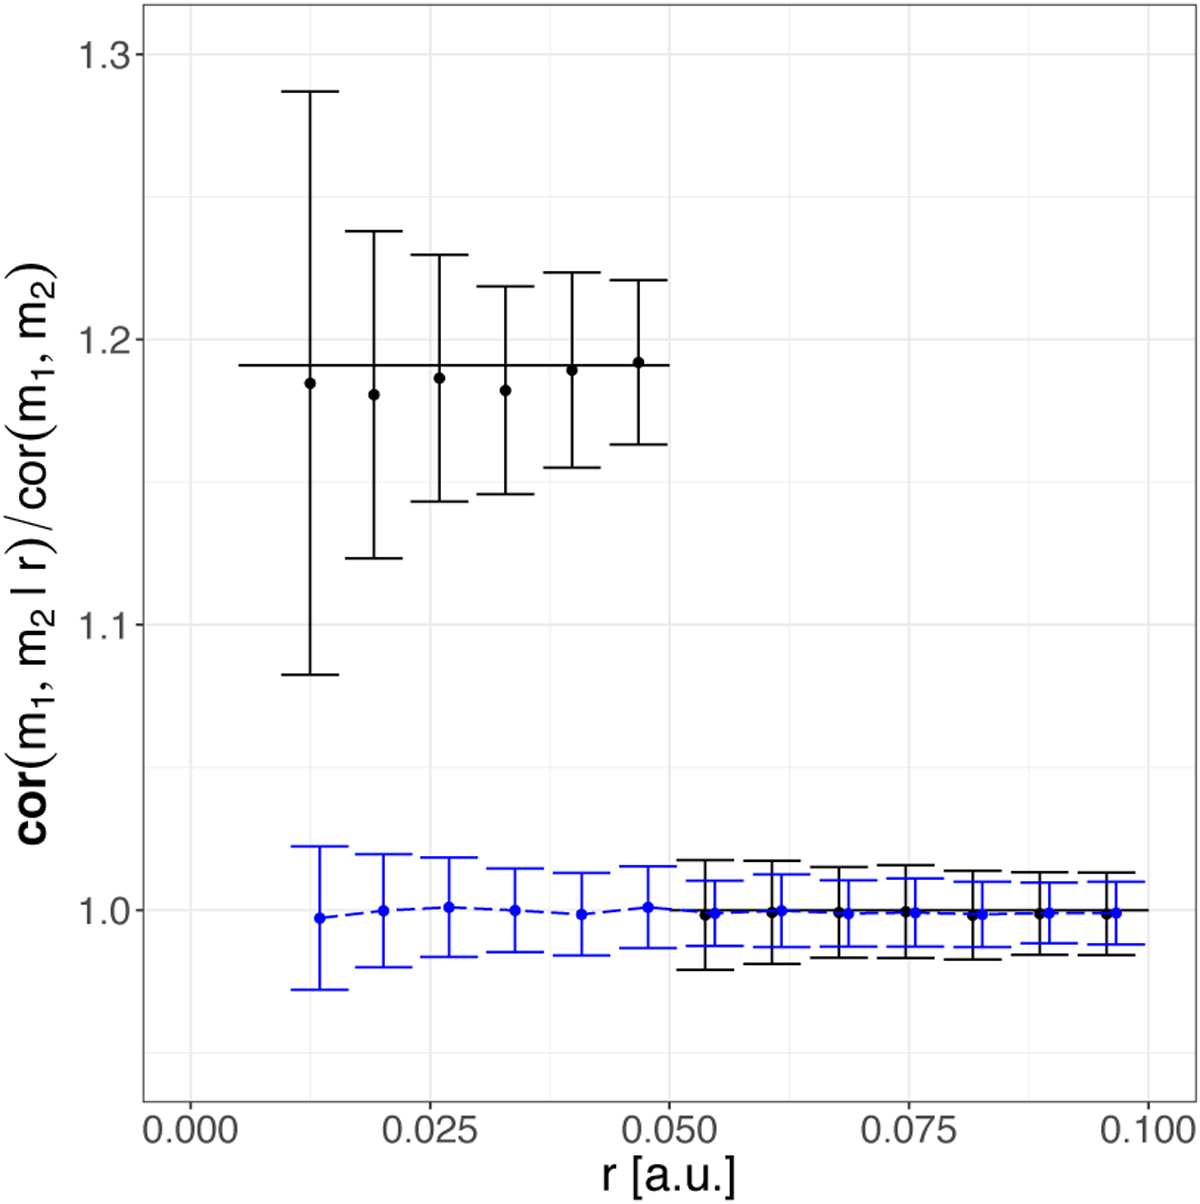
Value of cor(m1, m2 | r)∕cor(m1, m2) estimated from 100 realisations of a marked Poisson process with R = 0.05 and ϱ = 10 000 in the unit box (points with 1σ error bars). The solid line is the theoretical curve according to Eq. (B.1). The blue dashed curve shows the results for ![]() (with x-coordinates slightly shifted for better visibility).
(with x-coordinates slightly shifted for better visibility).
Current usage metrics show cumulative count of Article Views (full-text article views including HTML views, PDF and ePub downloads, according to the available data) and Abstracts Views on Vision4Press platform.
Data correspond to usage on the plateform after 2015. The current usage metrics is available 48-96 hours after online publication and is updated daily on week days.
Initial download of the metrics may take a while.