Fig. 6
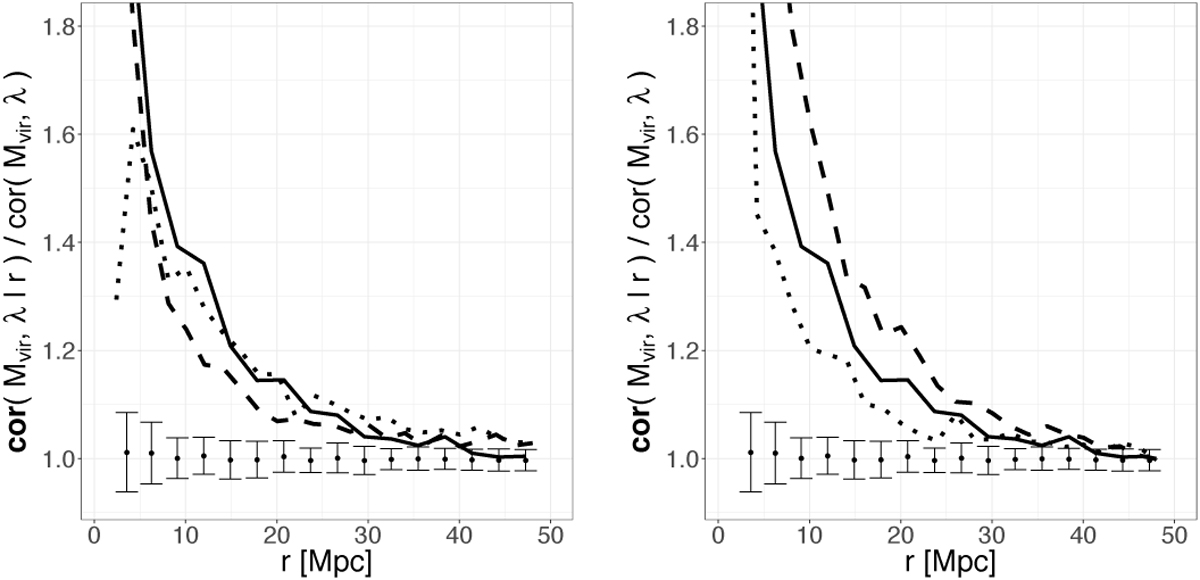
Left plot: cor(Mvir, λ | r)∕cor(Mvir, λ) are shown for samples with a mass cut Mvir ≥ 5 × 10¹¹M⊙ h−1 (dashed), Mvir ≥ 1 × 10¹²M⊙ h−1 (solid line), and Mvir ≥ 1013M⊙ h−1 (dotted). Right plot: the results from samples using various halo identification methods are shown: Rockstar distinct haloes (solid line), Rockstar all haloes (dotted), and FoF haloes (dashed).
Current usage metrics show cumulative count of Article Views (full-text article views including HTML views, PDF and ePub downloads, according to the available data) and Abstracts Views on Vision4Press platform.
Data correspond to usage on the plateform after 2015. The current usage metrics is available 48-96 hours after online publication and is updated daily on week days.
Initial download of the metrics may take a while.