Fig. 3
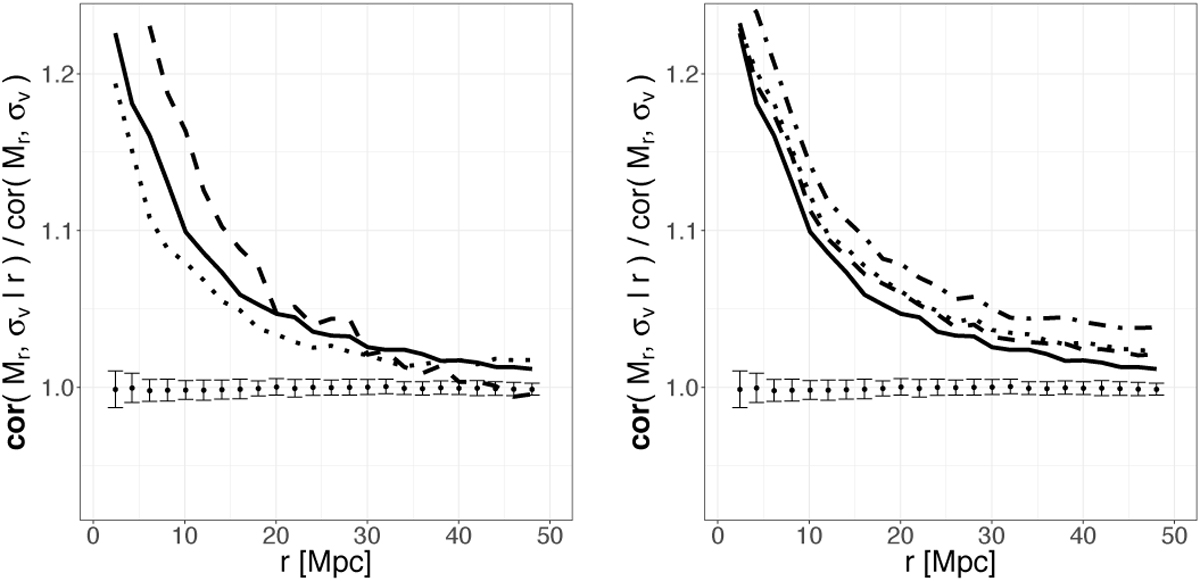
Left plot: cor(Mr, σv | r)∕cor(Mr, σv) from volume limited samples with 300 Mpc depth (dotted), 600 Mpc depth (solid line), and 900 Mpc depth (dashed) are shown. Right plot: The results from the samples with various estimates of the absolute magnitude: K-corrected and extinction corrected (dereddened) model magnitudes (solid line), without extinction correction (dotted), without K-correction (dashed), without both, extinction correction and K-correction (dash-dotted).
Current usage metrics show cumulative count of Article Views (full-text article views including HTML views, PDF and ePub downloads, according to the available data) and Abstracts Views on Vision4Press platform.
Data correspond to usage on the plateform after 2015. The current usage metrics is available 48-96 hours after online publication and is updated daily on week days.
Initial download of the metrics may take a while.