Fig. 1
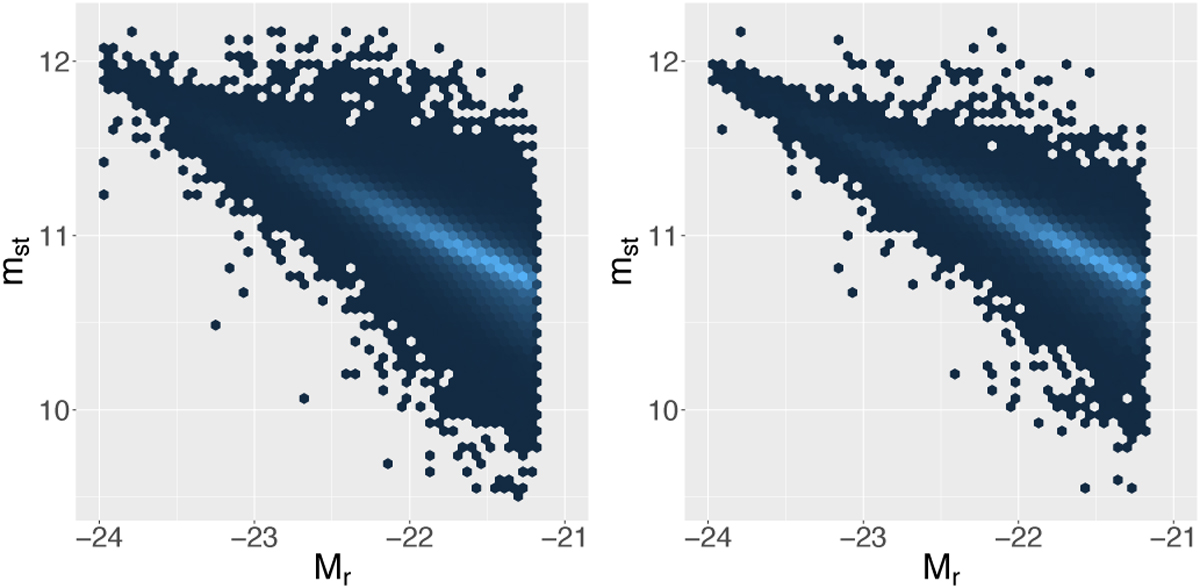
Both plots: Relative frequencies of galaxies in the (Mr, mst)-plane are shown.The brighter the colour, the higher the frequency within a given pixel. The left plot is shown with all galaxies, whereas the right plot only shows galaxies with a neighbouring galaxy at a distance of r ∈ [1, 3] Mpc. The normalisation of the logarithmic quantities Mr and mst is given in Appendix A.1.
Current usage metrics show cumulative count of Article Views (full-text article views including HTML views, PDF and ePub downloads, according to the available data) and Abstracts Views on Vision4Press platform.
Data correspond to usage on the plateform after 2015. The current usage metrics is available 48-96 hours after online publication and is updated daily on week days.
Initial download of the metrics may take a while.