Fig. 9
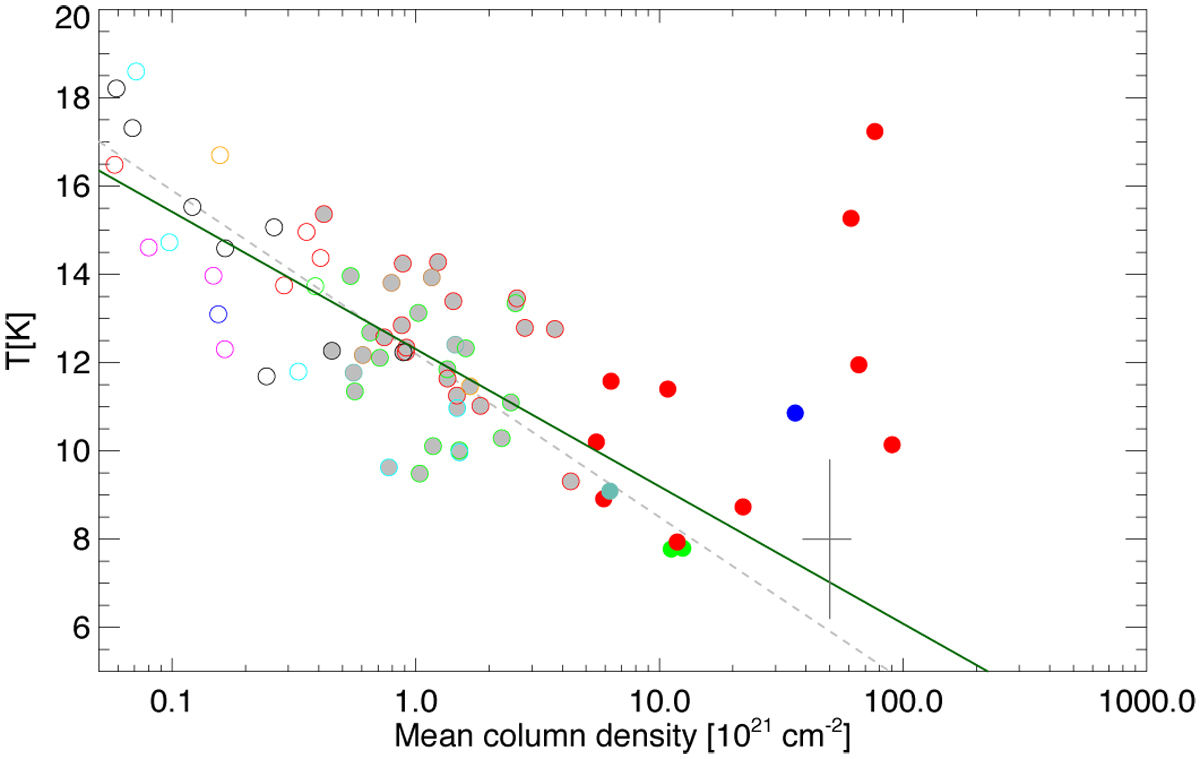
Mean dust temperature versus the mean column density of the respective core. Sources are colour-coded by region, with solid filled cores denoting prestellar cores and hollow circles denoting the starless cores. The cross on the figure shows the mean errors for this population of cores. The solid green line shows the relation T = −3.5log10 N(H2) + 86.0. The dashed grey line is the relation T = −3.7log10 N(H2) + 15.9 found by Marsh et al. (2016) for cores in Taurus L1495.
Current usage metrics show cumulative count of Article Views (full-text article views including HTML views, PDF and ePub downloads, according to the available data) and Abstracts Views on Vision4Press platform.
Data correspond to usage on the plateform after 2015. The current usage metrics is available 48-96 hours after online publication and is updated daily on week days.
Initial download of the metrics may take a while.