Free Access
Fig. D.2
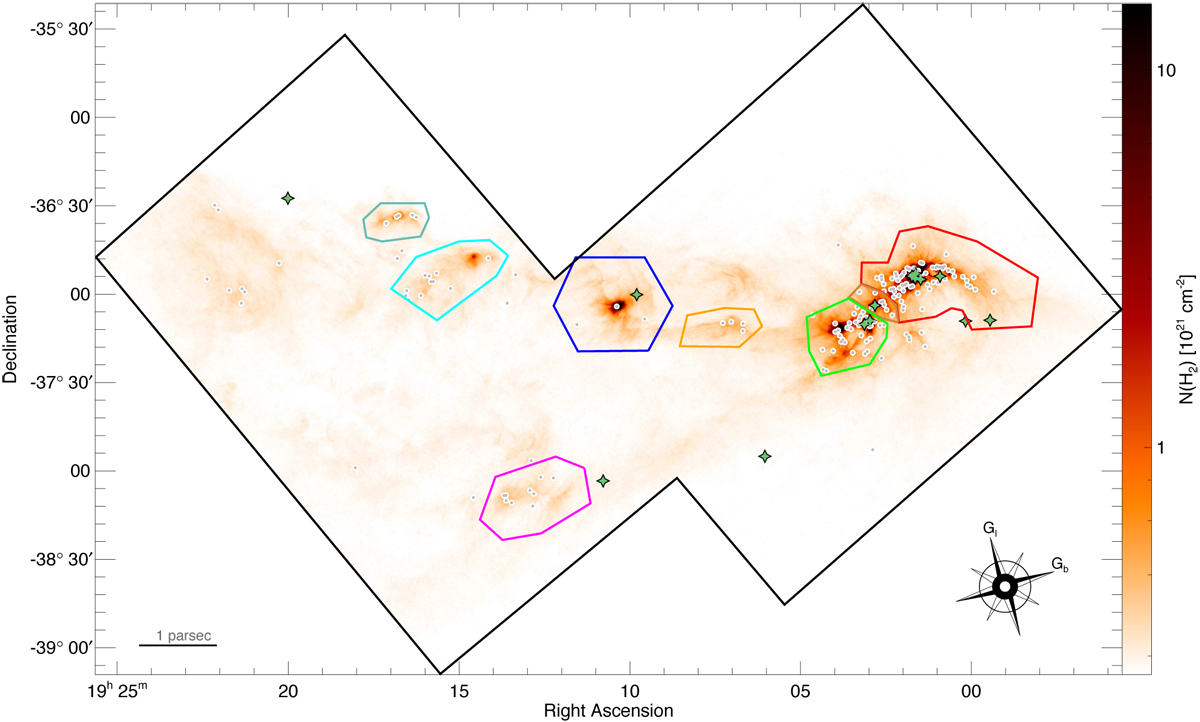
Following colours are used for subregions; red for CrA-A; brown for CrA-B; green for CrA-C, orange for CrA-D; dark blue for CrA-E; cyan for CrA-F; sea green for CrA-G; magenta for CrA-H. The background is the high-resolution column density map.
Current usage metrics show cumulative count of Article Views (full-text article views including HTML views, PDF and ePub downloads, according to the available data) and Abstracts Views on Vision4Press platform.
Data correspond to usage on the plateform after 2015. The current usage metrics is available 48-96 hours after online publication and is updated daily on week days.
Initial download of the metrics may take a while.