Fig. B.2
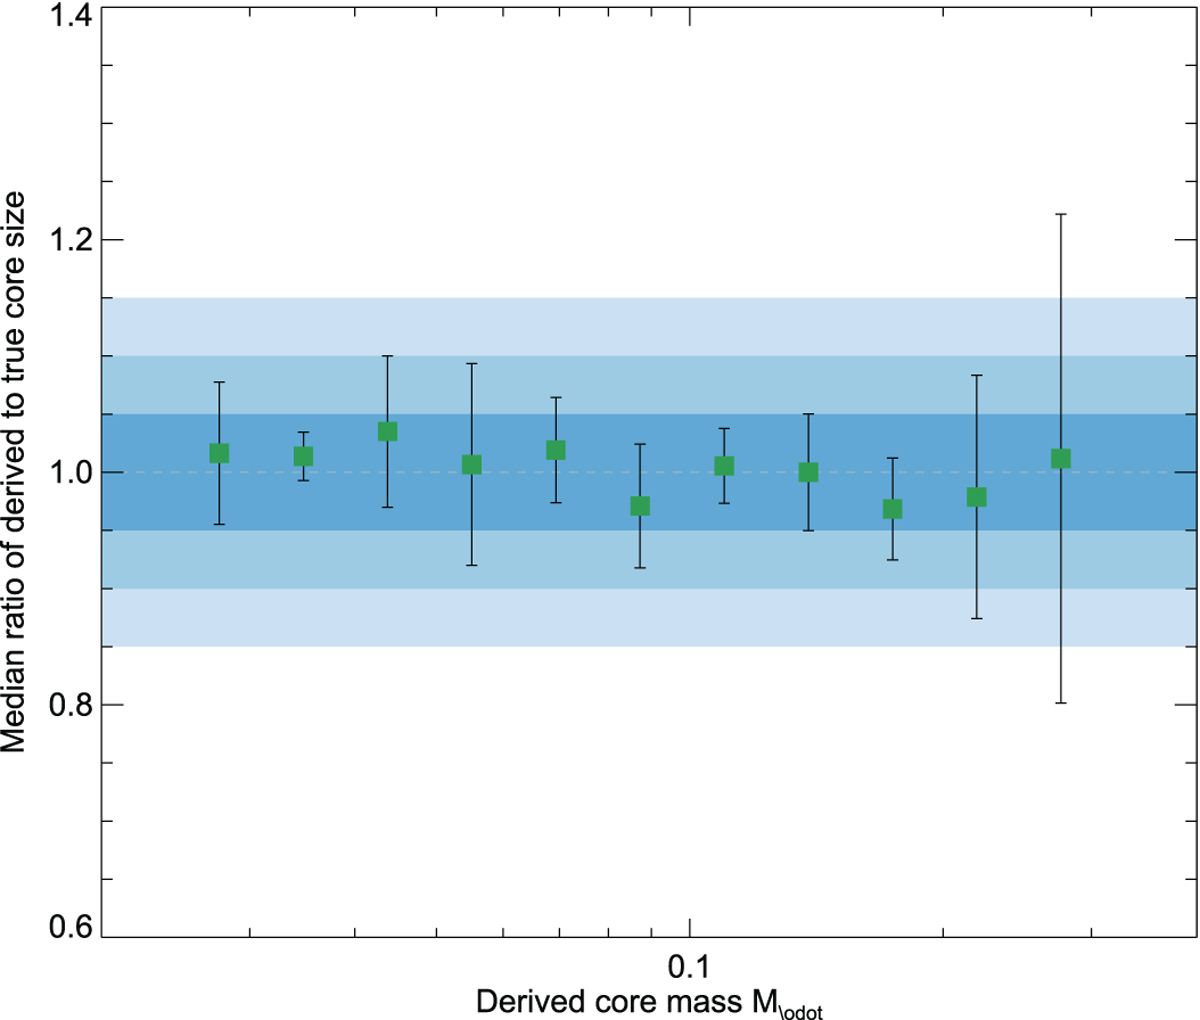
True core mass against the median ratio of derived to true core size. The error bars are the standard deviation of the sizes in each core bin. The horizontal dashed line marks a size ratio of 1. The three shaded blue bands from darkest to lightest, represent 5%, 10%, and 15% differences in mass ratio, respectively. The median core size in each bin remains within 5% of the true core size.
Current usage metrics show cumulative count of Article Views (full-text article views including HTML views, PDF and ePub downloads, according to the available data) and Abstracts Views on Vision4Press platform.
Data correspond to usage on the plateform after 2015. The current usage metrics is available 48-96 hours after online publication and is updated daily on week days.
Initial download of the metrics may take a while.