| Issue |
A&A
Volume 614, June 2018
|
|
|---|---|---|
| Article Number | L2 | |
| Number of page(s) | 5 | |
| Section | Letters to the Editor | |
| DOI | https://doi.org/10.1051/0004-6361/201833363 | |
| Published online | 14 June 2018 | |
Letter to the Editor
Cosmic dance at z ~ 3: Detecting the host galaxies of the dual AGN system LBQS 0302–0019 and Jil with HAWK-I+GRAAL⋆
1
Max Planck Institute for Astronomy, Königstuhl 17, 69117 Heidelberg, Germany
e-mail: This email address is being protected from spambots. You need JavaScript enabled to view it.
2
Centre for Extragalactic Astronomy, Durham University, South Road, Durham, DH1 3LE, UK
3
European Southern Observatory, Karl-Schwarzschild-Str. 2, 85748 Garching bei München, Germany
4
Institut für Physik und Astronomie, Universität Potsdam, Karl-Liebknecht-Str. 24/25, 14476 Potsdam, Germany
Received:
4
May
2018
Accepted:
23
May
2018
Abstract
We recently discovered that the luminous radio-quiet quasi-stellar objects (QSO) LBQS 0302–0019 at z = 3.286 is likely accompanied by an obscured AGN at 20 kpc projected distance, which we dubbed Jil. It represents the tightest candidate system of an obscured and unobscured dual AGN at z > 3. To verify the dual AGN scenario, we obtained deep Ks band (rest-frame V band) imaging with the VLT/HAWK-I+GRAAL instrument at 0.″4 resolution during science verification in January 2018. We detect the individual host galaxies of the QSO and Jil with estimated stellar masses of log(M⋆/M⊙) = 11.4 ± 0.5 and log(M⋆/M⊙) = 0.9 ± 0.5, respectively. Near-IR spectra obtained with Very Large Telescope-K-band Multi Object Spectrograph (VLT-KMOS) reveal a clear [O III] λ5007 line detection at the location of Jil that does not contribute significantly to the Ks band flux. Both observations therefore corroborate the dual AGN scenario. A comparison to Illustris simulations suggests a parent halo mass of log(Mhalo/M⊙) = 13.2 ± 0.5 for this interacting galaxy system, corresponding to a massive dark matter halo at that epoch.
Key words: Galaxies: interactions / Galaxies: high-redshift / large-scale structure of Universe / instrumentation: adaptive optics / quasars: individual: LBQS 0302−0018
Based on observations collected at the European Organisation for Astronomical Research in the Southern Hemisphere under ESO programme(s) 60.A-9471(A) and 100.A-0134(B).
© ESO 2018
1. Introduction
Major mergers were initially thought to be one of the main triggering mechanisms for luminous quasi-stellar objects (QSO, e.g., Sanders et al. 1988; Canalizo & Stockton 2001; Hopkins et al. 2005). While major mergers certainly promote gas fueling toward the centers of galaxies in merging systems (e.g., Di Matteo et al. 2005; Springel et al. 2005), it is currently heavily debated whether this is really the dominant mode for fueling supermassive black holes (SMBHs) and triggering the most luminous QSOs (e.g., Cisternas et al. 2011; Kocevski et al. 2012; Mechtley et al. 2016). For QSOs at z > 6, a [C II] survey with ALMA revealed that luminous QSOs exhibit an excess in the number counts of massive companion galaxies within < 100 kpc (Decarli et al. 2017), suggesting that dense environments and interactions might play an important role in the rapid evolution of the first SMBH systems in the Universe. However, for these systems, only one of the expected SMBHs in the merging galaxies is usually seen to be active.
Recently, we discovered with MUSE at the Very Large Telescope (VLT) that the luminous radio-quiet QSO LBQS 0302−0019 is accompanied by a luminous He II emitter, dubbed Jil, about 2.″9 (20 kpc) away (Husemann et al. 2018). The emission of Jil is best explained by an embedded obscured active galactic nucleus (AGN), so that the system represents the tightest pair of an unobscured and obscured AGN at z > 3. Frey & Gabányi (2018) analyzed archival Very Large Array radio images that revealed radio emission at the location of LBQS 0302−0019, but not at the position of Jil. This agrees with the expected AGN luminosity ratio at the depth of the radio data. The current radio data therefore do not provide additional constraints on the nature of Jil, and high-resolution X-ray observations with Chandra have not been obtained so far.
In this Letter we present K-band spectroscopy and adaptive-optics assisted imaging confirming the presence of a massive host galaxy at the location of Jil as a necessary requirement for the dual AGN scenario. Furthermore, we estimate the associated halo mass of this system based on one of the current hydrodynamical numerical simulations.
We adopt a flat cosmology with Ωm = 0.3, ΩΛ = 0.7, and H0 = 70 km s−1 Mpc−1. The physical scale at z = 3.286 is 7.48 kpc arcsec−1 and magnitudes are given in the Vega system.
2. Observations and data reduction
2.1. VLT/HAWK-I+GRAAL Ks-band imaging
We targeted this dual AGN system during the science verification (SV) with the GRound-layer Adaptive optics Assisted by Laser instrument (GRAAL, Paufique et al. 2010), which provides a seeing enhancer for the wide-field near-infrared imager HAWK-I (Casali et al. 2006) at the VLT. HAWK-I covers a 7.′5 × 7.′5 field of view (FoV) using an array of 2 × 2 Hawaii-2RG detectors with a 15″ gap between the four quadrants. We observed LBQS 0302–0019 in the Ks band during the SV run from 2–5 January 2018. The observations were split into two separate observing blocks consisting of 12 dithered pointings with 20 × 10 s exposures each. The QSO was centered in quadrants 1 and 3 of the detector array in the respective observing blocks, which amounts to 4800 s on source exposure time.
The data were reduced with the standard ESO pipeline for HAWK-I. The photometric zero-point for the combined image was determined through aperture photometry of two bright 2MASS stars in the common field of the two pointings. We consider that the photometric zero-point  estimated in this way has an intrinsic uncertainty of 0.1 mag. An image cutout of the dual AGN system region is shown in Fig. 1 and clearly reveals a prominent continuum source exactly at the expected location of Jil at a spatial resolution of 0.″4 (FWHM).
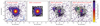 |
Fig. 1 Ks-band image from VLT/HAWK-I of LBQS 0302–0019 and Jil with a spatial resolution of 0.″4 (FWHM). From left to right, we present panel a) the original Ks-band image, panel b) the PSF taken from a nearby star properly scaled to the QSO based on the best-fit GALFIT model, panel c) the residual image after QSO component subtraction, and panel d) the residual image with overplotted Lyα contours (red) at 0.2, 0.4, 0.6, 0.8 × 10⁻¹⁶ erg s−1 cm−2 arcsec−2 and He II λ1640 contours (green) at 0.4, 0.6, 0.8, 1.0, and 1.2 × 10⁻¹⁷ erg s−1 cm−2 arcsec−2 from the VLT-MUSE observations (Husemann et al. 2018) with a spatial resolution of 1″ (FWHM). Strong PSF residuals from the QSO in the Lyα and He II contours have been masked out for clarity. |
2.2. KMOS near-IR integral-field spectroscopy
We also observed the dual AGN system with the K-band Multi Object Spectrograph (KMOS, Sharples et al. 2013). The KMOS data were taken on 27 January 2018 as part of a back-up program of the VLT LBG Redshift Survey (VLRS; Bielby et al. 2013, 2017), intended to fill gaps in the guaranteed observing time that are due to pointing restrictions, sub-optimal sky conditions, and gaps in the distribution of primary target fields on the sky.
KMOS is a near-IR multi-object integral field unit (IFU) instrument mounted on VLT UT4. It consists of 24 individual 2.″8 × 2.″8 IFUs (with pixel scales of 0.″2). Only two IFUs were used to cover the dual AGN system. For these observations, KMOS was operated with the HK grism in place, providing wavelength coverage from 1.484 μm to 2.442 μm, with a spectral resolution ranging from R ~ 1500 to R ~ 2500 correspondingly.
Observations were taken in nod-to-sky mode with an ABAABAAB pattern, where A and B represent the two nod positions. Given the proximity of Jil to LBQS 0302–0019, we were unable to place IFUs on the two targets simultaneously, and so Jil was targeted during nod position B, and LBQS 0302–0019 was targeted in position A. In both cases, the IFUs nodded to selected empty sky locations in their respective “off” nod positions, to aid sky removal from the science exposures. The two IFUs were positioned to provide some overlap in their coverage, resulting in overlaps of ≈ 0.″8 in R.A. and ≈ 1.″8 in declination. Each nod was observed for 600s, leading to integration times on LBQS 0302–0019 and Jil of 3000s and 1800s, respectively.
The data were reduced using ESOREX with the standard ESO pipeline recipes (Davies et al. 2013), incorporating dark and fiat frame subtraction, wavelength calibration, illumination correction, standard star flux calibration, and the overall processing and stacking. The final image quality of the cube is 0.″65 (FWHM). We used the KMOS SKY-TWEAK routine to optimally remove the near-IR sky lines and applied the Zurich Atmosphere Purge (ZAP; Soto et al. 2016) code on the final cube to further suppress sky line residuals.
3. Results
3.1. QSO subtraction
Given the brightness of the QSO LBQS 0302-0019, it is crucial to subtract the QSO light to properly resolve the host galaxies of the QSO and Jil in the HAWK-I data. To estimate the QSO contribution, we first created an empirical point-spread function (PSF) from the nearby star 2MASS J03044733–0007499  , which is just 40″ away from the QSO. In a second step, we used GALFIT (v3, Peng et al. 2010) to model the data as a superposition of a single Sersić profile for each of the two galaxies and a point source for the QSO. During the fitting, we fixed the Sersić index to n = 1 to avoid nonphysically large indices, which are caused by the extreme brightness ratio for the QSO host galaxy and the low spatial resolution of 2.8 kpc (FWHM) compared to the expected galaxy size. The resulting model and QSO subtracted image are shown in Fig. 1, from which we infer
  for the QSO host galaxy and
  for Jil.
3.2. Host morphology
The HAWK-I Ks image (Fig. 1c) reveals that the host galaxy of Jil appears asymmetric in the rest-frame V band with a faint extension toward the west side. It is unclear at the given spatial resolution and depth whether Jil is one distorted galaxy or itself a merger of two galaxies. In comparison, the bright knot in the H I Lyα nebula recovered with MUSE is centered on Jil (Fig. 1d) and traces its morphology well, considering that the resolution is more than twice lower. The same applies to the Hen II λ1640 Å emission, but it is more compact and shows a slight preference to the peak shortly west of Jil. The clear matching of the highly ionized gas with the presence of a distinct galaxy at the location of Jil is consistent with the picture of an obscured AGN at its center, but it is not a clear proof for the AGN presence as such.
3.3. Rest-frame optical nebular emission
From the KMOS data we reconstructed an [O III] λ5007 narrowband image at the redshift of the system (Fig. 2). In addition to the bright emission from the QSO, we detect also faint [O III] emission with 5σ significance at the location of Jil, as expected for an obscured AGN. The observed line flux is f[O III] = (2.5 ± 0.5) × 10−17 erg cm−2 s−1 corresponding to L[O III] = (2.4 ± 0.5) × 1042 erg s−1. With the conversion factor of Lbol/L[O III] ≈ 3500 from Heckman et al. (2004), we estimate a bolometric luminosity for Jil of Lbol ~ 4.4 × 1045 erg s−1 with a systematic uncertainty of 0.4 dex due to the scatter in the relation.
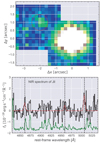 |
Fig. 2 Upper panel: Narrow-band image (25 Å wide in the observed frame) centered on the redshifted [O III] λ5007 extracted from the KMOS datacube. The QSO dominates the emission, but a weak source is detected at the location of Jil. Lower panel: Aperture spectrum (black line) within 0.″5 radius centered on Jil zoomed-in to the wavelength range covering the redshifted Hβ and [O III] λλ4960,5007 lines (vertical dashed lines). The green line represent the error spectrum (offset by −2 × 10⁻¹⁸ for readability) to highlight the position of sky lines. The best-fit model with a fixed [O III] doublet ratio is shown as the red line. |
Compared to the bolometric luminosity of Lbol = 1 × 1048 erg s−1 for LBQS 0302–0019 (Shen 2016), the [O III]-based luminosity of Jil is a factor of 100–620 lower. This is slightly higher than our constraints from the He II photoionization models (Husemann et al. 2018), which required a minimum luminosity of a factor 600–1000 fainter than LBQS 0302–0018, assuming a distance of 100 pc of the ionized gas clouds to the obscured AGN. This discrepancy can be easily explained either by a larger distance of the gas clouds from the AGN, or by the effect of dust extinction on the He II emission line.
We cannot detect any other emission lines such as [O III] λ4960, Hβ, or [O II] λλ3726, 3729 at the location of Jil in the shallow KMOS data. Since [O III] λ5007 is the brightest line in case of AGN ionization, we expect non-detections for all other lines given the signal-to-noise ratio (S/N) of our data. To estimate the emission-line contribution to the HAWK-I broad band observations, we assumed an [O III] doublet line ratio of 3 (Storey & Zeippen 2000) and ([O III] λ5007)/Hβ ~ 10 to create a mock emission-line spectrum for the Ks band. This leads to an expected pure emission-line brightness of  (Vega), confirming that contributions from lines can be safely neglected in the HAWK-I Ks band.
3.4. Stellar masses and halo mass
At z = 3.3, the age of the Universe was about 1.8 Gyr, which sets a hard boundary for the age of the stellar population. However, the rest-frame V band mass-to-light ratio is still changing by an order of magnitude within the possible range in ages from 100 Myr to 1.8 Gyr and metallicity (Fig. 3), based on the Bruzual & Charlot (2003) stellar population models and assuming a Chabrier initial mass function. While the f ar-UV line diagnostics imply subsolar metallicity (Husemann et al. 2018), we adopt a mean massto-light ratio of log(M⋆/Lv) = −0.75 ± 0.5 to be conservative, which leads to stellar masses of log(M⋆/M⊙) = 11.4 ± 0.5 and log(M⋆/M⊙) = 10.9 ± 0.5 for the QSO host and Jil, respectively. The uncertainties in the stellar masses are entirely dominated by the uncertainty in the stellar age and the corresponding mass-tolight ratio rather than photometric errors. Given a BH mass of MBH = 2.3 × 10⁹ M⊙ (Shen 2016), the inferred host galaxy mass of the QSO is fully consistent with the high-z MBH–M⋆ relation (e.g., Jahnke et al. 2009).
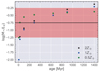 |
Fig. 3 Rest-frame V band mass-to-light ratio as a function of stellar population age for three metallicities. For our purpose, we adopt a mean mass-to-light ratio of log(M⋆/Lv) = − 0.75 (black line) with an uncertainty of ±0.5 dex (red shaded band). |
To place this system in perspective, we considered the dark matter halo distribution from the Illustris simulation (Vogelsberger et al. 2014), covering a comoving volume of 106.5 Mpc3. We selected halos containing a close pair (<50 kpc) of sub-halos containing stellar masses of log(M⋆/M⊙) > 9.0 and stellar mass ratios M1/M2 < 10. At z ~ 3.3, the Illustris catalog contains 21 such systems (Fig. 4), but none at the total stellar mass we estimated for our dual AGN system. We therefore fit the halo mass as a function of the combined stellar mass with a power law to extrapolate the observed trend to higher masses. Given the combined stellar mass for the QSO and Jil, we find a range in halo masses of 12.8 < log(Mhalo/M⊙) < 13.7, which corresponds to a very massive dark matter halo at that redshift based on predicted halo mass functions (e.g., Watson et al. 2013).
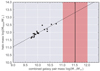 |
Fig. 4 Parent halo mass as a function of total stellar mass at z ~ 3.3 from the Illustris simulation (Vogelsberger et al. 2014) for nearly equal mass M1/M2 < 10 galaxy pairs with a separation smaller than 50 kpc. The position of our dual AGN pair system is indicated by the vertical black line, with uncertainties highlighted by the red shaded area. There is no similar system in Illustris due to the limited volume (106.5 Mpc3 comoving), but the extrapolation from lower masses (dashed line) implies a parent halo mass of 12.8 < log(Mhalo/M⊙) < 13.7. |
4. Discussion
Luminous QSOs at high redshifts are thought to be associated with massive dark matter halos and dense environments because a rapid BH growth at early cosmic epoch is required. Observational evidence of overdensities around high-redshift luminous QSOs has been established in several ways. Luminous radio-loud AGN at 1.2 < z < 3 have been found to systematically reside in galaxy overdensities on arcminute scales (e.g., Ivison et al. 2000; Smail et al. 2003; Wylezalek et al. 2013; Rigby et al. 2014; Malavasi et al. 2015; Jones et al. 2015; Silva et al. 2015). Similar studies for radio-quiet AGN have also revealed galaxy overdensities around them (e.g., Utsumi et al. 2010; Capak et al. 2011; Morselli et al. 2014; Jones et al. 2017), although contradictory results have been reported (Kikuta et al. 2017; Mazzucchelli et al. 2017). Furthermore, halo masses of luminous AGN have been estimated through clustering studies, which either found that they reside in overdensities (e.g., Croom et al. 2002; Coil et al. 2009) or in normal environments (Coil et al. 2007). The inconsistencies may be related to the intrinsic properties of QSOs as BH mass has been suggested to correlate most strongly with the halo mass (e.g., Krumpe et al. 2015) or that different galaxy populations, such as Lyα emitters, Lyman-break galaxies, or dusty galaxies, are considered for the clustering analysis. Nevertheless, recent clustering measurements of AGN in the COSMOS field yield a typical halo mass of ~1013 M⊙ at z ~ 3 (Allevato et al. 2016), in agreement with our results.
Other works focused on the local environment around luminous QSOs. Here, it is striking to see that luminous QSOs reveal an excess in the number counts of massive star-forming galaxies in their vicinity at z > 6 (Decarli et al. 2017) and z ~ 4.8 (Trakhtenbrot et al. 2017). This is in agreement with the notion of a strongly clustered galaxy environment around QSOs at high redshifts (e.g., García-Vergara et al. 2017) and an excess of unobscured dual AGN with <40 kpc separations (Hennawi et al. 2006). Although the AGN environment is certainly significantly evolving with redshift, luminous AGN, such as LBQS 0302–0019, may be signposts of the most vigorous evolution of galaxies in overdensities at early epochs.
5. Conclusion
Based on deep K-band spectroscopy with KMOS and highresolution imaging with HAWK-I+GRAAL, we have identified the massive (log(M⋆/M⊙) = 10.9 ± 0.5) host galaxy of Jil, the obscured companion AGN to LBQS0302-0019 at a projected separation of about 20 kpc. This clearly supports the obscured AGN nature of Jil since the presence of a massive host galaxy implies the existence of a super-massive black hole, potentially powering an AGN. Hence, we expect a direct detection of AGN engine signatures from Jil in the radio (core emission), mid-IR (torus) or X-rays (disk corona) with sufficiently deep observations.
The combined stellar mass of both galaxies suggests a very massive parent halo of this intriguing dual AGN system. This is in agreement with observations of the environment around luminous AGN comparable to LBQS 0302–0019 at similar or even higher redshifts. It suggests that these luminous AGN are part of and shaped by a vigorous evolutionary phase that might be important to set the properties of massive present-day galaxies.
Acknowledgments
We thank the anonymou s referee for a fast and constructive review. We particularly thank A. van der Wel for helpful discussion about high-redshift galaxy properties, and A. Pillepich for an introduction to the Illustris simulations data. RMB, TS, and JWL acknowledge the Science and Technology Facilities Council (STFC; grant ST,IP000541/1) for support. JLW acknowledges support from an STFC Ernest Rutherford Fellowship (ST,IP004784/1). We also thank A. Tiley for facilitating our KMOS observations.
References
- Allevato V., Civano F., Finoguenov A., et al. 2016, ApJ, 832, 70 [NASA ADS] [CrossRef] [Google Scholar]
- Bielby R., Hill M. D., Shanks T., et al. 2013, MNRAS, 430, 425 [NASA ADS] [CrossRef] [Google Scholar]
- Bielby R. M., Shanks T., Crighton N. H. M., et al. 2017, MNRAS, 471, 2174 [NASA ADS] [CrossRef] [Google Scholar]
- Bruzual G., Charlot S.. 2003, MNRAS, 344, 1000 [NASA ADS] [CrossRef] [Google Scholar]
- Canalizo G., & Stockton A.. 2001, ApJ, 555, 719 [NASA ADS] [CrossRef] [Google Scholar]
- Capak P. L., Riechers D., Scoville N. Z., et al. 2011, Nature, 470, 233 [Google Scholar]
- Casali M., Pirard J.-F., Kissler-Patig M., et al. 2006, in Proc. SPlE, 6269, 62690W [Google Scholar]
- Cisternas M., Jahnke K., Inskip K. J., et al. 2011, ApJ, 726, 57 [NASA ADS] [CrossRef] [Google Scholar]
- Coil A. L., Hennawi J. F., Newman J. A., Cooper M. C., & Davis M.. 2007, ApJ, 654, 115 [NASA ADS] [CrossRef] [Google Scholar]
- Coil A. L., Georgakakis A., Newman J. A., et al. 2009, ApJ, 701, 1484 [NASA ADS] [CrossRef] [Google Scholar]
- Croom S. M., Boyle B. J., Loaring N. S., et al. 2002, MNRAS, 335, 459 [NASA ADS] [CrossRef] [Google Scholar]
- Davies R. I., Agudo Berbel A., Wiezorrek E., et al. 2013, A&A, 558, A56 [NASA ADS] [CrossRef] [EDP Sciences] [Google Scholar]
- Decarli R., Walter F., Venemans B. P., et al. 2017, Nature, 545, 457 [NASA ADS] [CrossRef] [Google Scholar]
- Di Matteo T., Springel V., Hernquist L.. 2005, Nature, 433, 604 [NASA ADS] [CrossRef] [PubMed] [Google Scholar]
- Frey S., & Gabányi K. É.. 2018, Res. Notes AAS, 2, 49 [CrossRef] [Google Scholar]
- García-Vergara C., Hennawi J. F., Barrientos L. F., & Rix H.-W. 2017, ApJ, 848, 7 [NASA ADS] [CrossRef] [Google Scholar]
- Heckman T. M., Kauffmann G., Brinchmann J., et al. 2004, ApJ, 613, 109 [NASA ADS] [CrossRef] [Google Scholar]
- Hennawi J. F., Strauss M. A., Oguri M., et al. 2006, AJ, 131, 1 [NASA ADS] [CrossRef] [Google Scholar]
- Hopkins P. F., Hernquist L., Cox T. J., et al. 2005, ApJ, 630, 705 [NASA ADS] [CrossRef] [Google Scholar]
- Husemann B., Worseck G., ArrigoniBattaia F., & Shanks T. 2018, A&A, 610, L7 [NASA ADS] [CrossRef] [EDP Sciences] [Google Scholar]
- Ivison R. J., Dunlop J. S., Smail I., et al. 2000, ApJ, 542, 27 [NASA ADS] [CrossRef] [Google Scholar]
- Jahnke K., Bongiorno A., Brusa M., et al. 2009, ApJ, 706, L215 [NASA ADS] [CrossRef] [Google Scholar]
- Jones S. F., Blain A. W., Lonsdale C., et al. 2015, MNRAS, 448, 3325 [NASA ADS] [CrossRef] [Google Scholar]
- Jones S. F., Blain A. W., Assef R. J., et al. 2017, MNRAS, 469, 4565 [NASA ADS] [CrossRef] [Google Scholar]
- Kikuta S., Imanishi M., Matsuoka Y., et al. 2017, ApJ, 841, 128 [NASA ADS] [CrossRef] [Google Scholar]
- Kocevski D. D., Faber S. M., Mozena M., et al. 2012, ApJ, 744, 148 [NASA ADS] [CrossRef] [Google Scholar]
- Krumpe M., Miyaji T., Husemann B., et al. 2015, ApJ, 815, 21 [NASA ADS] [CrossRef] [Google Scholar]
- Malavasi N., Bardelli S., Ciliegi P., et al. 2015, A&A, 576, A101 [NASA ADS] [CrossRef] [EDP Sciences] [Google Scholar]
- Mazzucchelli C., Bañados E., Decarli R., et al. 2017, ApJ, 834, 83 [NASA ADS] [CrossRef] [Google Scholar]
- Mechtley M., Jahnke K., Windhorst R. A., et al. 2016, ApJ, 830, 156 [NASA ADS] [CrossRef] [Google Scholar]
- Morselli L., Mignoli M., Gilli R., et al. 2014, A&A, 568, A1 [NASA ADS] [CrossRef] [EDP Sciences] [Google Scholar]
- Paufique J., Bruton A., Glindemann A., et al. 2010, in Proc. SPIE, 7736, 77361P [CrossRef] [Google Scholar]
- Peng C. Y., Ho L. C., Impey C. D., & Rix H. 2010, AJ, 139, 2097 [NASA ADS] [CrossRef] [Google Scholar]
- Rigby E. E., Hatch N. A., Röttgering H. J. A., et al. 2014, MNRAS, 437, 1882 [NASA ADS] [CrossRef] [Google Scholar]
- Sanders D. B., Soifer B. T., Elias J. H., Neugebauer G., & Matthews K. 1988, ApJ, 328, L35 [NASA ADS] [CrossRef] [Google Scholar]
- Sharples R., Bender R., Agudo Berbel A., et al. 2013, The Messenger, 151, 21 [NASA ADS] [Google Scholar]
- Shen Y.. 2016, ApJ, 817, 55 [NASA ADS] [CrossRef] [Google Scholar]
- Silva A., Sajina A., Lonsdale C., & Lacy M. 2015, ApJ, 806, L25 [NASA ADS] [CrossRef] [Google Scholar]
- Smail I., Scharf C. A., Ivison R. J., et al. 2003, ApJ, 599, 86 [NASA ADS] [CrossRef] [Google Scholar]
- Soto K. T., Lilly S. J., Bacon R., Richard J., & Conseil S. 2016, MNRAS, 458, 3210 [NASA ADS] [CrossRef] [Google Scholar]
- Springel V., Di Matteo T., & Hernquist L. 2005, ApJ, 620, L79 [NASA ADS] [CrossRef] [Google Scholar]
- Storey P. J., & Zeippen C. J. 2000, MNRAS, 312, 813 [Google Scholar]
- Trakhtenbrot B., Lira P., Netzer H., et al. 2017, ApJ, 836, 8 [NASA ADS] [CrossRef] [Google Scholar]
- Utsumi Y., Goto T., Kashikawa N., et al. 2010, ApJ, 721, 1680 [NASA ADS] [CrossRef] [Google Scholar]
- Vogelsberger M., Genel S., Springel V., et al. 2014, Nature, 509, 177 [NASA ADS] [CrossRef] [Google Scholar]
- Watson W. A., Iliev I. T., D’Aloisio A., et al. 2013, MNRAS, 433, 1230 [Google Scholar]
- Wylezalek D., Galametz A., Stern D., et al. 2013, ApJ, 769, 79 [NASA ADS] [CrossRef] [Google Scholar]
All Figures
|
Fig. 1 Ks-band image from VLT/HAWK-I of LBQS 0302–0019 and Jil with a spatial resolution of 0.″4 (FWHM). From left to right, we present panel a) the original Ks-band image, panel b) the PSF taken from a nearby star properly scaled to the QSO based on the best-fit GALFIT model, panel c) the residual image after QSO component subtraction, and panel d) the residual image with overplotted Lyα contours (red) at 0.2, 0.4, 0.6, 0.8 × 10⁻¹⁶ erg s−1 cm−2 arcsec−2 and He II λ1640 contours (green) at 0.4, 0.6, 0.8, 1.0, and 1.2 × 10⁻¹⁷ erg s−1 cm−2 arcsec−2 from the VLT-MUSE observations (Husemann et al. 2018) with a spatial resolution of 1″ (FWHM). Strong PSF residuals from the QSO in the Lyα and He II contours have been masked out for clarity. |
| In the text | |
|
Fig. 2 Upper panel: Narrow-band image (25 Å wide in the observed frame) centered on the redshifted [O III] λ5007 extracted from the KMOS datacube. The QSO dominates the emission, but a weak source is detected at the location of Jil. Lower panel: Aperture spectrum (black line) within 0.″5 radius centered on Jil zoomed-in to the wavelength range covering the redshifted Hβ and [O III] λλ4960,5007 lines (vertical dashed lines). The green line represent the error spectrum (offset by −2 × 10⁻¹⁸ for readability) to highlight the position of sky lines. The best-fit model with a fixed [O III] doublet ratio is shown as the red line. |
| In the text | |
|
Fig. 3 Rest-frame V band mass-to-light ratio as a function of stellar population age for three metallicities. For our purpose, we adopt a mean mass-to-light ratio of log(M⋆/Lv) = − 0.75 (black line) with an uncertainty of ±0.5 dex (red shaded band). |
| In the text | |
|
Fig. 4 Parent halo mass as a function of total stellar mass at z ~ 3.3 from the Illustris simulation (Vogelsberger et al. 2014) for nearly equal mass M1/M2 < 10 galaxy pairs with a separation smaller than 50 kpc. The position of our dual AGN pair system is indicated by the vertical black line, with uncertainties highlighted by the red shaded area. There is no similar system in Illustris due to the limited volume (106.5 Mpc3 comoving), but the extrapolation from lower masses (dashed line) implies a parent halo mass of 12.8 < log(Mhalo/M⊙) < 13.7. |
| In the text | |
Current usage metrics show cumulative count of Article Views (full-text article views including HTML views, PDF and ePub downloads, according to the available data) and Abstracts Views on Vision4Press platform.
Data correspond to usage on the plateform after 2015. The current usage metrics is available 48-96 hours after online publication and is updated daily on week days.
Initial download of the metrics may take a while.