Fig. A.1.
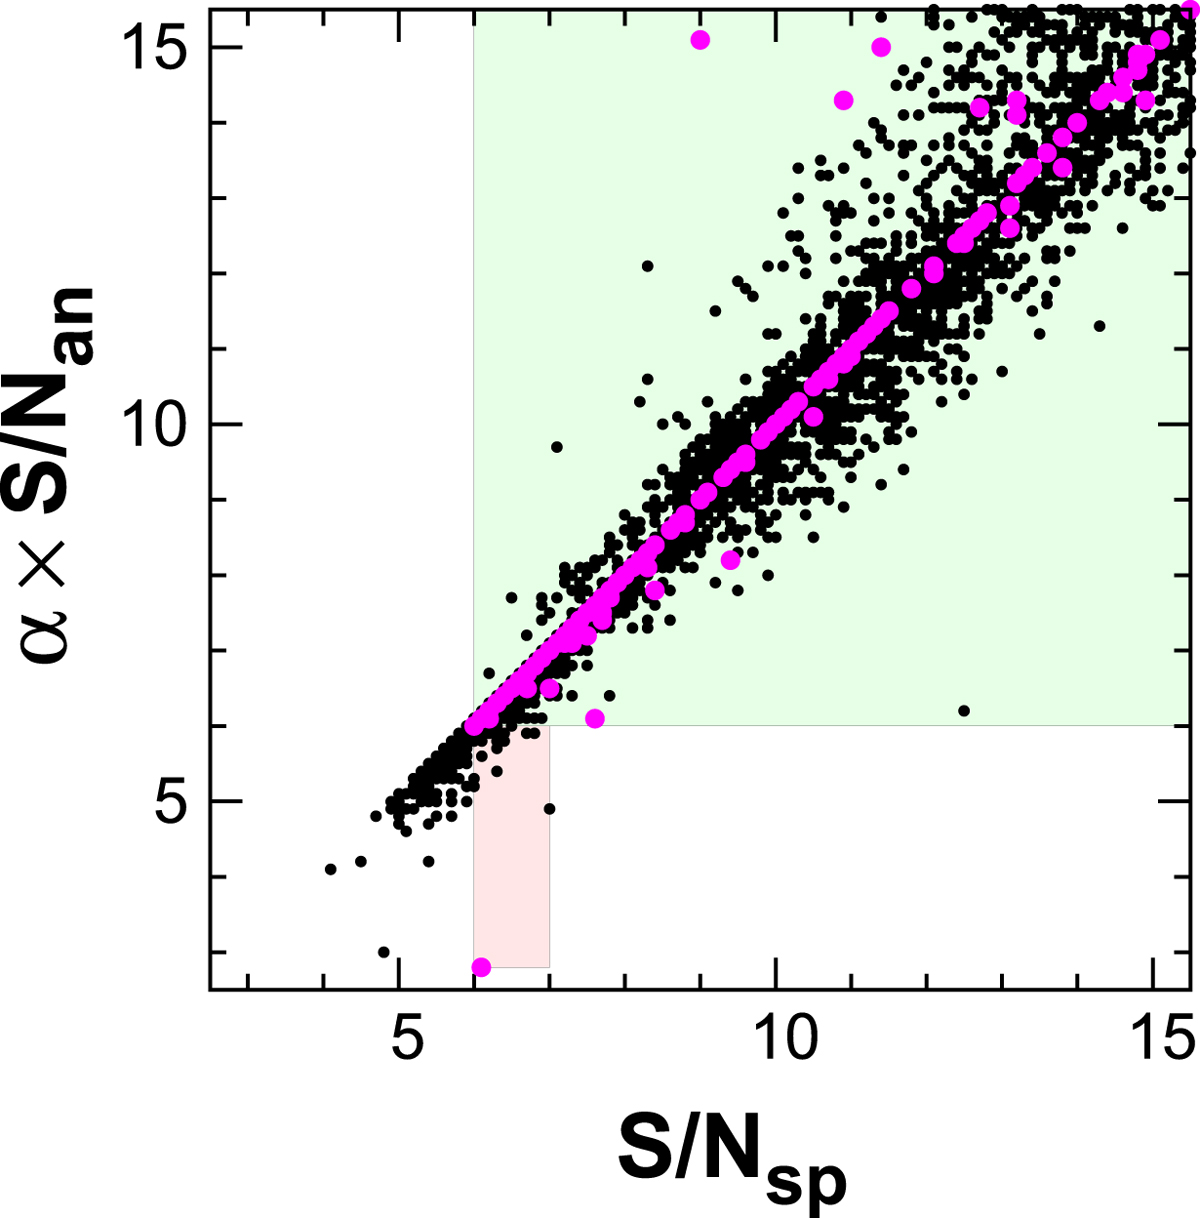
Detected S/N (S/Nsp) in the Fourier spectra vs. the calibrated analytical S/N (S/Nan). Each star is characterized by its own calibration factor α and (S/Nan). The calibration has been derived from injected signal tests, as described in the text. The MACHO and K2 stars are plotted by black and magenta, respectively. Pale green and red rectangles denote the parameter regimes where the two S/N estimates yield consistent and inconsistent detection results, respectively.
Current usage metrics show cumulative count of Article Views (full-text article views including HTML views, PDF and ePub downloads, according to the available data) and Abstracts Views on Vision4Press platform.
Data correspond to usage on the plateform after 2015. The current usage metrics is available 48-96 hours after online publication and is updated daily on week days.
Initial download of the metrics may take a while.