Free Access
Fig. 5.
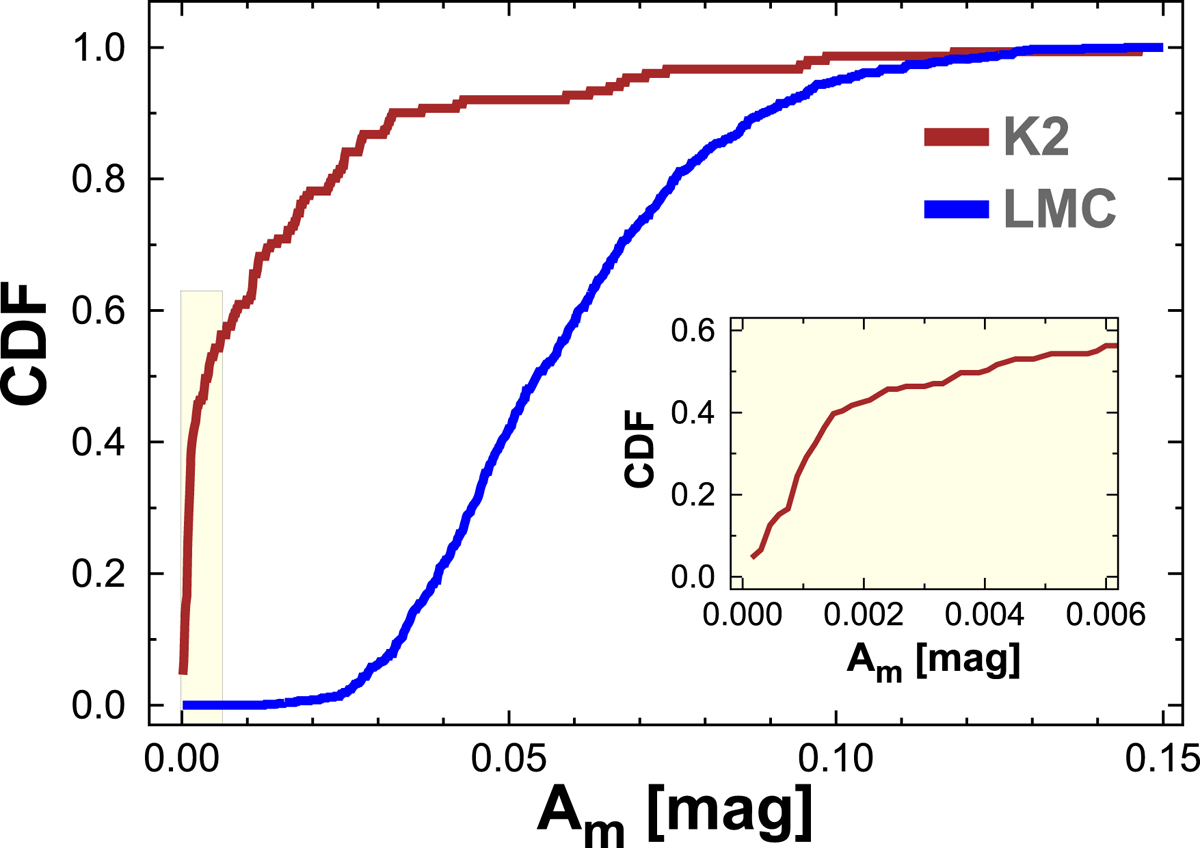
Cumulative distribution function of the maximum side lobe amplitudes of the 138 BL stars identified in this work. For comparison, the same function is also shown for the 731 BL stars identified in the MACHO LMC sample by Alcock et al. (2003). The inset shows the blow-up of the region indicated in the main plot.
Current usage metrics show cumulative count of Article Views (full-text article views including HTML views, PDF and ePub downloads, according to the available data) and Abstracts Views on Vision4Press platform.
Data correspond to usage on the plateform after 2015. The current usage metrics is available 48-96 hours after online publication and is updated daily on week days.
Initial download of the metrics may take a while.