Fig. 4.
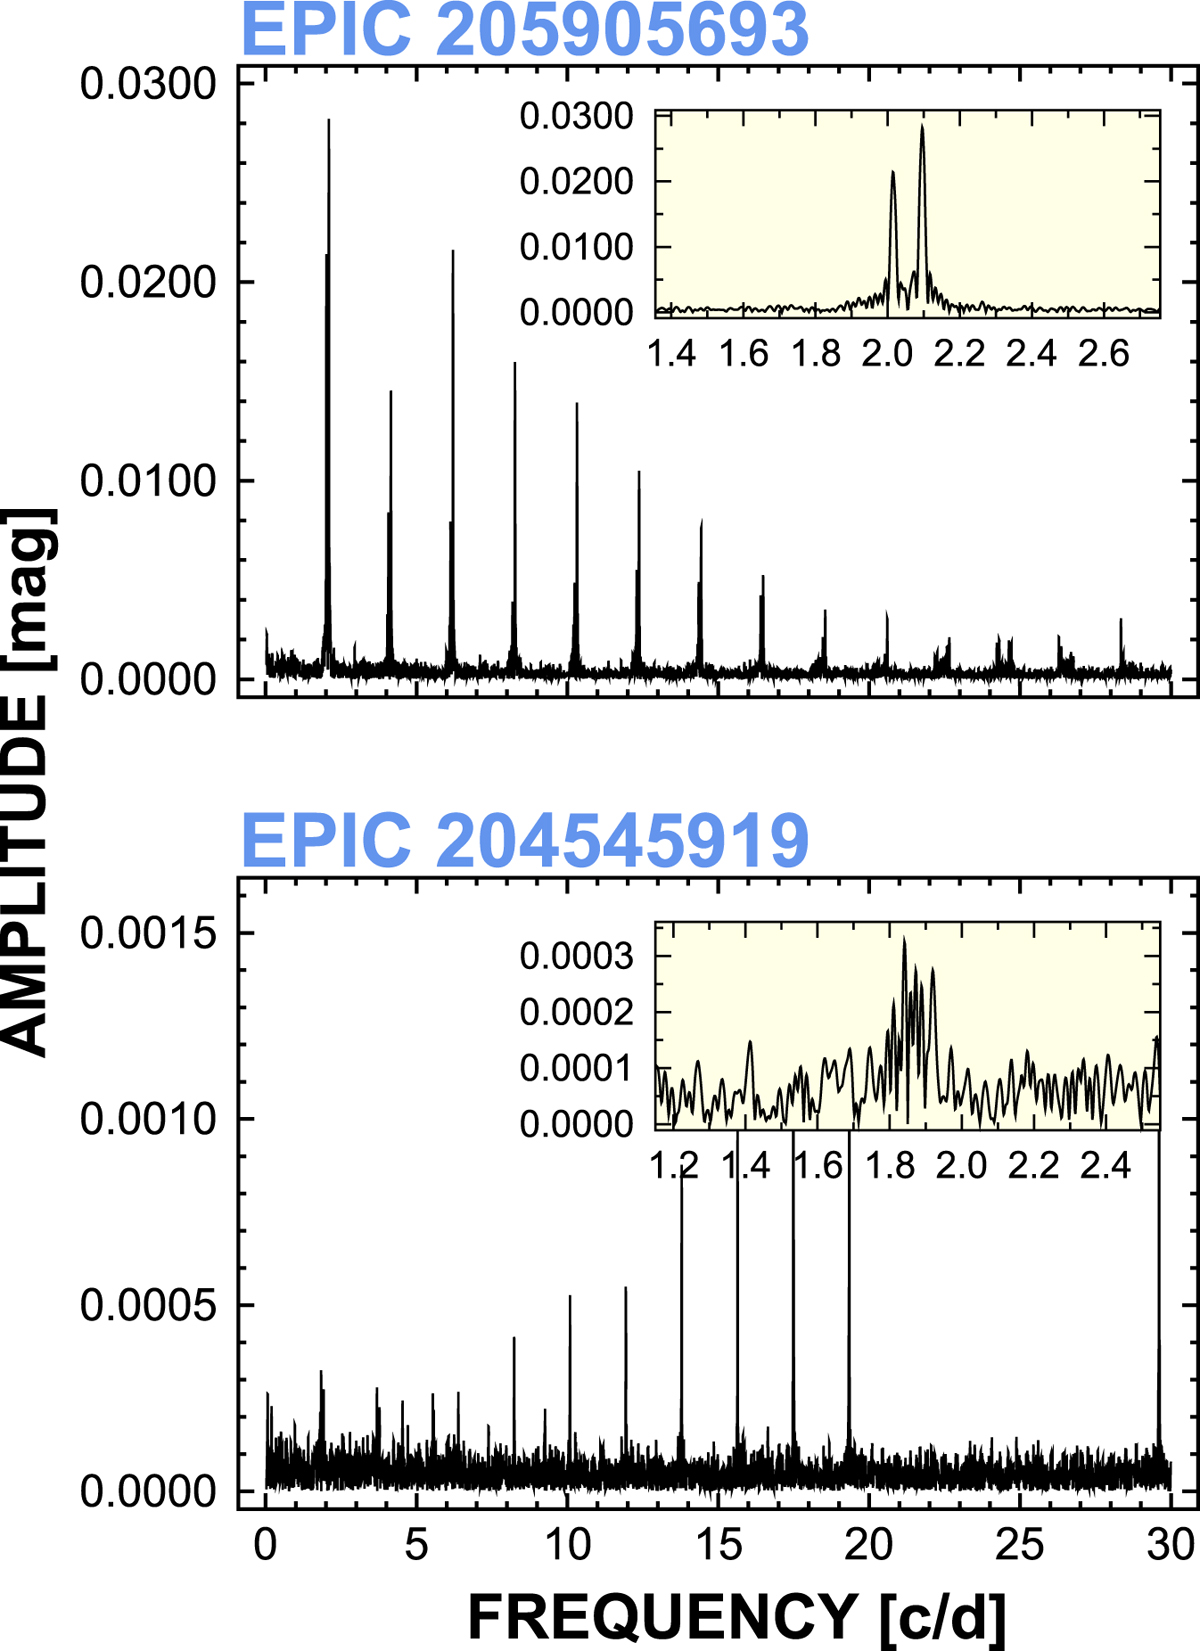
Examples for high (upper panel) and low S/N (lower panel) detections. The amplitude spectra shown are the results of the DFT analysis of the TFA(FOUR) time series using the fundamental pulsation frequencies and their first 14 harmonics both in the TFA filtering and in the pre-whitening. The peaks come either from the BL side lobes or from the high-frequency components leaked through the Nyquist frequency at ~24.47 c/d.
Current usage metrics show cumulative count of Article Views (full-text article views including HTML views, PDF and ePub downloads, according to the available data) and Abstracts Views on Vision4Press platform.
Data correspond to usage on the plateform after 2015. The current usage metrics is available 48-96 hours after online publication and is updated daily on week days.
Initial download of the metrics may take a while.