| Issue |
A&A
Volume 614, June 2018
|
|
|---|---|---|
| Article Number | A97 | |
| Number of page(s) | 5 | |
| Section | Planets and planetary systems | |
| DOI | https://doi.org/10.1051/0004-6361/201832806 | |
| Published online | 20 June 2018 | |
Comparison of the orbital properties of Jupiter Trojan asteroids and Trojan dust
Astronomy Research Unit, University of Oulu,
90014
Oulu,
Finland
e-mail: This email address is being protected from spambots. You need JavaScript enabled to view it.
Received:
10
February
2018
Accepted:
7
March
2018
Abstract
In a previous paper we simulated the orbital evolution of dust particles from the Jupiter Trojan asteroids ejected by the impacts of interplanetary particles, and evaluated their overall configuration in the form of dust arcs. Here we compare the orbital properties of these Trojan dust particles and the Trojan asteroids. Both Trojan asteroids and most of the dust particles are trapped in the Jupiter 1:1 resonance. However, for dust particles, this resonance is modified because of the presence of solar radiation pressure, which reduces the peak value of the semi-major axis distribution. We find also that some particles can be trapped in the Saturn 1:1 resonance and higher order resonances with Jupiter. The distributions of the eccentricity, the longitude of pericenter, and the inclination for Trojans and the dust are compared. For the Trojan asteroids, the peak in the longitude of pericenter distribution is about 60 degrees larger than the longitude of pericenter of Jupiter; in contrast, for Trojan dust this difference is smaller than 60 degrees, and it decreases with decreasing grain size. For the Trojan asteroids and most of the Trojan dust, the Tisserand parameter is distributed in the range of two to three.
Key words: meteorites, meteors, meteoroids / planets and satellites: rings / minor planets, asteroids: general / zodiacal dust / celestial mechanics / solar wind
© ESO 2018
1 Introduction
Dust ejecta are generated when hypervelocity interplanetary micrometeoroids impact the surfaces of atmosphereless bodies (Krüger et al. 1999; Horányi et al. 2015; Szalay & Horányi 2016). As of July 2016, there are about 4266 known Jupiter Trojan asteroids in the L4 swarm and 2341 in the L5 swarm (JPL Small-Body Database Search Engine). In previous work, we estimated the total cross section of the Trojan asteroids that is exposed to the interplanetary flux, and evaluated the production rate of ejecta particles from the Trojan asteroids (Liu & Schmidt 2018). We also simulated the subsequent evolution of these ejecta particles after ejection, and derived their steady-state spatial configuration.
The orbital parameter distribution of the Trojan asteroids has received considerable interest (Jewitt et al. 2000; Yoshida & Nakamura 2005). The motion of the Trojan dust particles is influenced by non-gravitational perturbation forces (see Sect. 2) so that their dynamics differs from that of the Trojan asteroids, which is reflected in their respective orbital properties. In this paper, we compare the orbital properties of the Jupiter Trojan asteroids and Trojan dust, which show a similar orbital behavior, but are also different in many aspects.
Because of their low number density, there is no detection yet of Trojan dust particles although upper limits on their cross section were inferred (Kuchner et al. 2000), and our work is based on numerical and analytical investigations. The Lucy spacecraft developed by NASA will be the first mission to conduct reconnaissance of Jupiter’s L4 and L5 Trojan asteroids (Levison et al. 2017). Because the dust particles are samples from the asteroid surfaces their in-situ compositional analysis by future space missions will allow researchers to directly determine the chemical composition of the asteroids (Sternovsky et al. 2017; Toyota et al. 2017).
2 Brief description of the dynamical model
In this paper, the orbital parameters are defined with respect to the Jupiter orbital inertial frame Oxoiyoizoi. The zoi axis points to the normal of Jupiter’s orbital plane at J2000 epoch, the xoi axis is taken to be the intersection of Jupiter’s orbital plane with Jupiter’s equator plane at J2000 epoch, and the yoi axis follows the right-hand rule. The Trojans’ orbital elements in the J2000 ecliptic reference frame are obtained from the JPL Small-Body Database Search Engine, and then are transformed to the frame Oxoiyoizoi.
For the dust particles we analyze simulation results from a previous study (Liu & Schmidt 2018). Here we briefly describe our model. Compared with asteroids, dust particles are subject to non-gravitational forces including solar radiation pressure, Poynting–Robertson (P−R) drag, solar wind drag, and the Lorentz force due to the interplanetary magnetic field. We adopt silicate as the material for Trojan dust. In our simulations, particles in the size range [0.5, 32] μm are included. For each size, 100 particles from L4 Trojans are simulated until they hit Jupiter or their Jovicentric distances lie outside the region of interest, [0.5, 15] au. For the details of the dynamical model and numerical simulations, the readers are referred to Liu & Schmidt (2018) and Liu et al. (2016).
3 Distribution of semi-major axis a and orbital resonances
We start our analysis from the distribution of the semi-major axis for L4 Trojans andTrojan dust (Fig. 1). As expected, the distribution of the Trojans’ semi-major axes peaks around aJupiter (5.2 au), while the peak for the dust population is smaller and much wider. This is mainly because of the effect of solar radiation pressure combined with the Jupiter 1:1 mean motion resonance.
The direction of solar radiation pressure is opposite to that of the solar gravitational force. Thus, the effect of solar radiation pressure can be included in terms of the effective solar mass Meff = MSun(1 − β) (Kresák 1976), where MSun is the mass of the Sun. Other symbols with subscript “eff” in the text are defined when the effective solar mass Meff is considered. For grain sizes ≤ 2 μm, the Trojan particles have short lifetimes (Liu & Schmidt 2018) because the strong solar radiation pressure rapidly expels them away from the L4 region. Larger grains ≥4 μm can be trapped in the 1:1 resonance with Jupiter for a long time. The effective resonant argument Ψ1:1 of the particle’s 1:1 resonance with Jupiter is expressed as
 (1)
(1)
where λ is the mean longitude. At resonance,  (Murray & Dermott 1999), and the effective semi-major axis at the Jupiter 1:1 resonance is obtained as (Liou & Zook 1995; Liou et al. 1995)
![Mathematical equation: \begin{equation*}a_{\mathrm{eff,\, 1:1}} = a_{\mathrm{Jupiter}} \left[\frac{M_{\mathrm{Sun}}(1-\beta)}{M_{\mathrm{Sun}}+M_{\mathrm{Jupiter}}}\right]^{1/3}. \end{equation*}](/articles/aa/full_html/2018/06/aa32806-18/aa32806-18-eq3.png) (2)
(2)
Here MJupiter is the mass of Jupiter, and β is the ratio of solar radiation pressure relative to solar gravitational force (Burns et al. 1979). The value of β is size-dependent, the dependence of which on grain size for silicate particles can be found in Fig. 4b of Liu & Schmidt (2018). Kresák (1976) derived the relation between the effective and conventional semi-major axis when dust particles are released at the perihelion and aphelion of a comet. Because of the small eccentricity for the majority of dust particles, this relation can be simplified by neglecting the effect of eccentricity as
 (3)
(3)
Combining Eqs. (2) and (3), the conventional semi-major axis at the Jupiter 1:1 resonance is calculated as
![Mathematical equation: \begin{equation*}a_{\mathrm{1:1}} = a_{\mathrm{Jupiter}}\frac{1-2\beta}{1-\beta} \left[\frac{M_{\mathrm{Sun}}(1-\beta)}{M_{\mathrm{Sun}}+M_{\mathrm{Jupiter}}}\right]^{1/3}. \end{equation*}](/articles/aa/full_html/2018/06/aa32806-18/aa32806-18-eq5.png) (4)
(4)
It is apparent that a1:1 < aJupiter, and a1:1 becomes smaller with decreasing grain size because their β becomes larger. It follows that solar radiation pressure can efficiently decrease the values of semi-major axes. This explains why the peak in dust density is shifted radially inward from Jupiter (Fig. 7a of Liu & Schmidt 2018). As an example, Fig. 2 shows the evolution of the semi-major axis and resonant argument for an 8 μm particle for 1000 yr. The dust semi-major axis librates around a1:1 with nearly constant amplitude. The resonant argument Ψ1:1 = λeff–λJupiter librates around a fixed angle larger than 60° (Fig. 2a and b). The small wiggles in Fig. 2a and c are also induced by solar radiation pressure.
The distribution of the semi-major axis for 8 μm particles is bimodal (Fig. 1). This is because the rate of change for the semi-major axis is slowest near the turning points of the libration (Fig. 2a). As a result, these semi-major axis values contribute more to the distribution. The precise libration amplitudes are different for different particles of the same size, which is the reason why the peaks for 8 μm particles in Fig. 1 are wide. Particles of different grain size (≥ 4 μm) also possess this bimodal property. However, the bimodality is buried for the whole Trojan dust population because different peaks of various grain sizes are superimposed onto each other.
There exist particles that are not trapped in the Jupiter 1:1 resonance, or which can escape from this resonance. Due to various perturbation forces, these particles are transported either outwards or inwards, which does not occur for the Trojan asteroids themselves. Some grains can be trapped in the Saturn 1:1 resonance. Following the same procedure as for Eqs. (1)–(4), we can calculate the conventional semi-major axis at the Saturn 1:1 resonance. A 2 μm particle trapped in the Saturn 1:1 resonance is taken as an example (Fig. 3), for which the resonant semi-major axis is aSaturn 1:1 ≈ 8.78 au. The particle is transported outwards and gets trapped in and escapes the Saturn 1:1 resonance several times.
There are also particles that can be trapped in higher order resonances with Jupiter. As an example we show the trapping in the Jupiter (interior) 3:4 resonance (Fig. 4) and (exterior) 4:3 resonance (Fig. 5) for 2 μm particles. The resonant arguments are Ψ3:4 = 3λeff–4λJupiter + ϖeff and Ψ4:3 = 4λeff–3λJupiter–ϖeff. The resonant semi-major axes are calculated as a3:4 ≈ 3.94 au and a4:3 ≈ 5.78 au. In both cases, particles are trapped for more than 5000 yr. However, the trapping probabilities in the Saturn 1:1 resonance and the Jupiter higher order resonances are low. Thus, these resonances contribute little to the overall distribution of dust semi-major axis.
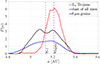 |
Fig. 1 Semi-major axis distribution for the L4 asteroids (red) and Trojan dust of all sizes (blue). The black line denotes the semi-major axis distribution for 8 μm particles. The size-dependent resonant semi-major axis a1:1 (Eq. (4)) is for 8 μm particles. |
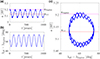 |
Fig. 2 Evolution of semi-major axis (a) and resonant argument Ψ1:1 = λeff–λJupiter (b) for an 8 μm particle. Panel c: semi-major axis versus λeff–λJupiter for an 8 μm particle for 1000 years of its evolution. Here the resonant semi-major axis a1:1 is also for 8 μm particles. |
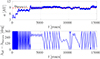 |
Fig. 3 Evolution of semi-major axis and resonant argument ΨSaturn 1:1 = λeff –λSaturn for a 2 μm particle. Here aSaturn 1:1 is for 2 μm particles. |
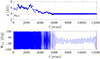 |
Fig. 4 Evolution of semi-major axis and resonant argument Ψ3:4 for a 2 μm particle. Here a3:4 is for 2 μm particles. |
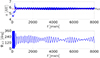 |
Fig. 5 Evolution of semi-major axis and resonant argument Ψ4:3 for a 2 μm particle. Here a4:3 is for 2 μm particles. |
4 Distributions of eccentricity e, longitude of pericenter ϖ, and inclination i
The eccentricity distributions for the L4 asteroids and Trojan dust of all sizes peak close to eJupiter (≈ 0.049), as shown in Fig. 6. This is because in the elliptic restricted three-body problem, the values a = aJupiter, e = eJupiter, and ϖ = ϖJupiter ± 60° are the stable equilateral solutions (e.g., Sándor & Érdi 2003; Robutel & Souchay 2010).
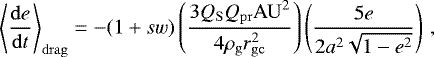
The peak value of the dust eccentricity distribution is slightly smaller than eJupiter. This is mainly because of the effects of P-R drag and solar wind drag. For large particles, the orbits are nearly Keplerian. Using the orbital average method, the effects of P-R drag and solar wind drag on eccentricity can be expressed as (Burns et al. 1979)
 (5)
(5)
where sw is the ratio of solar wind drag to P-R drag, QS is the radiation energy flux at one au, Qpr is the solar radiation pressure efficiency, ρg is the grain density, rg is the grain radius, and c is the light speed. On average these two drag forces reduce the value of eccentricity for larger particles. Large eccentricities are induced for particles with grain sizes ≤2 μm (Fig. 6). These small particles are affected by the strong solar radiation pressure and Lorentz force, which increase the probability of encounters with Jupiter, Saturn, or other planets. All these effects can excite large eccentricities.
We do not see obvious patterns in the distributions of ω (argument of pericenter) and Ω (longitude of ascending node). Instead, we take a look at the distribution of ϖ = ω + Ω. For the L4 asteroids and their dust, the distributions of ϖ are shown in Fig. 7. The peakof the Trojans’ ϖ distribution is about 60° larger than ϖJupiter. This is because ϖ = ϖJupiter + 60° is the stable equilateral solution in the elliptic restricted three-body problem (e.g., Sándor & Érdi 2003; Robutel & Souchay 2010), as mentioned above. To the knowledge of the authors, this peak with distribution of ϖ for the Jupiter Trojan asteroids has not been shown in the literature to date.
Roughly, the distributions of ϖ for the L4 asteroids and dust have the same shape. However, we note that for Trojan dust Δϖ= ϖpeak–ϖJupiter < 60°. The value of Δϖ becomes smaller with smaller grain size, if the grains can be trapped in the Jupiter 1:1 resonance. Seen from Fig. 7, for dust of all sizes, Δϖ ≈ 45°; while for 4 μm particles, Δϖ ≈ 37°.
Compared to the distributions of a, e, and ϖ, the inclination distribution of dust is closer to that of the L4 Trojans (Fig. 8). The reason is explained as follows. The variation of the inclination can be expressed as (Murray & Dermott 1999)
 (6)
(6)
where r is the Jovicentric distance, f is the true anomaly, n is the mean motion, and N is the normal component of the perturbation force relative to the orbital plane. Solar radiation pressure, P–R drag, and solar wind drag have no such normal component. Thus, these forces do not change orbital inclination (Burns et al. 1979). Although the Lorentz force has a normal component with respect to the dust orbital plane, for large particles the Lorentz force is weak because of its dependence on the inverse square of the grain size. Besides, the polarity of the interplanetary magnetic field rapidly changes with the 22 year period of the solar cycle (Gustafson 1994; Landgraf 2000), so the average effect of the Lorentz force on inclination is very small (Fahr et al. 1995; Moro-Martín & Malhotra 2003). Also because larger particles can stay in the system for a longer time, the inclination distribution of the whole dust population is roughly consistent with that of the L4 Trojans for the most part.
For small particles, the magnitude of Lorentz force is relatively strong; moreover, the value of β is relatively large, which implies that the dust orbit becomes non-Keplerian. As a result, the effect of the Lorentz force on inclination does not average out. This explains the remaining inclination difference between L4 Trojans and Trojan dust (small wiggles in Fig. 8). Taking 1 μm particles for instance, they can attain high inclination (black line in Fig. 8) due to the stronger Lorentz force (Fig. 9).
 |
Fig. 6 Eccentricity distribution of L4 asteroids (red) and Trojan dust of all sizes (blue). The black line denotes the eccentricity distribution of 2 μm particles. |
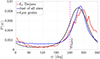 |
Fig. 7 Distribution of the longitude of pericenter for L4 asteroids (red) and Trojan dust of all sizes (blue). The black line denotes the distribution of longitude of pericenter for 4 μm particles. |
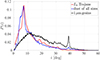 |
Fig. 8 Inclination distribution of the L4 asteroids (red) and Trojan dust of all sizes (blue). The black line denotes the inclination distribution of 1 μm particles. |
5 Distribution of the Tisserand parameter TP
The Tisserand parameter is a nearly conserved quantity in the circular restricted three-body problem, derived as an approximation to the Jacobi constant (Tisserand 1889; Murray & Dermott 1999). In celestial mechanics, the Tisserand parameter is often used for orbit classification (Levison 1996; Levison & Duncan 1997). The Tisserand parameter with respect to Jupiter is defined as
 (7)
(7)
Similar to the dynamical behavior of comets (Levison 1996; Levison & Duncan 1997), typical values of the Tisserand parameter for Jupiter Trojan asteroids satisfy 2 < TP < 3. From our simulations, we know that dust particles keep for most of their dynamical evolution a value of TP that is close to TP of their sources. As a consequence, the L4 Trojans and dust particles ejected from them have similar distributions of TP (Fig. 10). For the overwhelming part we have 2 < TP < 3. For dust particles there is a very small portion with values of TP > 3. This mainly attributes to particles in the size range [1, 2] μm. For these grain sizes, the lifetime is long enough for strong solar radiation pressure to increase the TP values. As an example the TP distribution for 2 μm particles is also shown in Fig. 10.
For dust released from the main belt asteroids (Dermott et al. 2002), we expect TP > 3 as their sources. Thus, determination of the orbital elements from the measured dust velocity should allow us to distinguish particles that were released from Trojan asteroids and from main belt asteroids. We note that Jupiter-family comets also have typical values of Tisserand parameters in the range 2 < TP < 3 (Levison 1996; Levison & Duncan 1997). However, for most of these comets the semi-major axes are much larger, or smaller, than those of Jupiter Trojans (5.2 au). Besides, eccentricities of Jupiter-family comets (> 0.2) are larger than the typical eccentricities of Jupiter Trojans. Thus, it will be possible as well to distinguish dust released from Trojan asteroids and dust from Jupiter-family comets in terms of their semi-major axes and eccentricities.
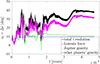 |
Fig. 9 Evolution of inclination starting from an initial value i0. The parameter Δi is the integral of the contribution to di∕dt due to different perturbation forces acting on a 1 μm particle. |
6 Conclusions
In previous work, we developed a numerical model for dust particles ejected from the Jupiter Trojans, and derived their configuration in space (Liu & Schmidt 2018). In this work, we compare the orbital properties of these Trojan dust particles and the Jupiter L4 asteroids. We find that the peak of semi-major axis distribution for Trojan dust is smaller than that for Trojans, which is mainly due to solar radiation pressure. The distribution of the semi-major axis for grain sizes ≥ 4 μm is bimodal. A fraction of the particles can be trapped in the Saturn 1:1 resonance and Jupiter higher order resonances. The peak of the eccentricity distribution for Trojan dust is also smaller than that for Trojans, which is because of the action of P–R drag. For the Trojan asteroids, the peak in the longitude of pericenter distribution is about 60° larger than Jupiter’s longitude of pericenter. For Trojan dust this difference is less than 60°, and it decreases with decreasing grain size. The inclination distributions of Trojans and Trojan dust are quite similar, except that small particles can attain large inclination due to the effect of the Lorentz force. The Trojan asteroids and most Trojan dust have typical values of Tisserand parameters in the range of two to three.
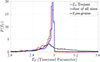 |
Fig. 10 Distribution of Tisserand parameter (relative to Jupiter) for L4 asteroids (red) and Trojan dust of all sizes (blue). The black line denotes the distribution of the Tisserand parameter for 2 μm particles. |
Acknowledgements
This work was supported by the European Space Agency under the project Jovian Micrometeoroid Environment Model (JMEM) (contract number: 4000107249/12/NL/AF) at the University of Oulu and by the Academy of Finland. Weacknowledge CSC – IT Center for Science for the allocation of computational resources on their Taito cluster.
References
- Burns, J. A., Lamy, P. L., & Soter, S. 1979, Icarus, 40, 1 [NASA ADS] [CrossRef] [Google Scholar]
- Dermott, S. F., Durda, D. D., Grogan, K., & Kehoe, T. J. J. 2002, in Asteroids III, eds. W. F. Bottke, A. Cellino, P. Paolicchi, & R. P. Binzel (Tucson: University of Arizona Press), 423 [Google Scholar]
- Fahr, H. J., Scherer, K., & Banaszkiewicz, M. 1995, Planet. Space Sci., 43, 301 [NASA ADS] [CrossRef] [Google Scholar]
- Gustafson, B. Å. S. 1994, Ann. Rev. Earth Planet. Sci., 22, 553 [Google Scholar]
- Horányi, M., Szalay, J. R., Kempf, S., et al. 2015, Nature, 522, 324 [NASA ADS] [CrossRef] [Google Scholar]
- Jewitt, D. C., Trujillo, C. A., & Luu, J. X. 2000, AJ, 120, 1140 [NASA ADS] [CrossRef] [Google Scholar]
- Kresák, L. 1976, Bull. Astr. Inst. Czechosl., 27, 35 [NASA ADS] [Google Scholar]
- Krüger, H., Krivov, A. V., Hamilton, D. P., & Grün, E. 1999, Nature, 399, 558 [NASA ADS] [CrossRef] [Google Scholar]
- Kuchner, M. J., Reach, W. T., & Brown, M. E. 2000, Icarus, 145, 44 [NASA ADS] [CrossRef] [Google Scholar]
- Landgraf, M. 2000, J. Geophys. Res., 105, 10303 [NASA ADS] [CrossRef] [Google Scholar]
- Levison, H. F. 1996, in Completing the Inventory of the Solar System, eds. T. Rettig & J. Hahn, ASP Conf. Proc., 107, 173 [Google Scholar]
- Levison, H. F., & Duncan, M. J. 1997, Icarus, 127, 13 [Google Scholar]
- Levison, H., Olkin, C., Noll, K., Marchi, S., & Lucy Team 2017, in 48th Lunar and Planetary Science Conference, 2025 [Google Scholar]
- Liou, J.-C., & Zook, H. A. 1995, Icarus, 113, 403 [NASA ADS] [CrossRef] [Google Scholar]
- Liou, J.-C., Zook, H. A., & Jackson, A. 1995, Icarus, 116, 186 [NASA ADS] [CrossRef] [Google Scholar]
- Liu, X., & Schmidt, J. 2018, A&A, 609, A57 [NASA ADS] [CrossRef] [EDP Sciences] [Google Scholar]
- Liu, X., Sachse, M., Spahn, F., & Schmidt, J. 2016, J. Geophys. Res.: Planets, 121, 1141 [NASA ADS] [CrossRef] [Google Scholar]
- Moro-Martín, A., & Malhotra, R. 2003, AJ, 125, 2255 [NASA ADS] [CrossRef] [Google Scholar]
- Murray, C. D., & Dermott, S. F. 1999, Solar System Dynamics (Cambridge University Press) [Google Scholar]
- Robutel, P., & Souchay, J. 2010, Lect. Notes Phys., 790, 195 [NASA ADS] [CrossRef] [Google Scholar]
- Sándor, Z., & Érdi, B. 2003, Celest. Mech. Dyn. Astron., 86, 301 [NASA ADS] [CrossRef] [Google Scholar]
- Sternovsky, Z., Hillier, J., Postberg, F., et al. 2017, in 48th Lunar and Planetary Science Conference, 2908 [Google Scholar]
- Szalay, J. R., & Horányi, M. 2016, ApJ, 830, L29 [NASA ADS] [CrossRef] [Google Scholar]
- Tisserand, F.-F. 1889, Traité de Mécanique Céleste. Tome IV (Paris: Gauthier-Villars) [Google Scholar]
- Toyota, H., Nishiyama, K., Kawakatsu, Y., et al. 2017, in 12th Low-Cost Planetary Missions Conference (Pasadena, California) [Google Scholar]
- Yoshida, F., & Nakamura, T. 2005, AJ, 130, 2900 [NASA ADS] [CrossRef] [Google Scholar]
All Figures
|
Fig. 1 Semi-major axis distribution for the L4 asteroids (red) and Trojan dust of all sizes (blue). The black line denotes the semi-major axis distribution for 8 μm particles. The size-dependent resonant semi-major axis a1:1 (Eq. (4)) is for 8 μm particles. |
| In the text | |
|
Fig. 2 Evolution of semi-major axis (a) and resonant argument Ψ1:1 = λeff–λJupiter (b) for an 8 μm particle. Panel c: semi-major axis versus λeff–λJupiter for an 8 μm particle for 1000 years of its evolution. Here the resonant semi-major axis a1:1 is also for 8 μm particles. |
| In the text | |
|
Fig. 3 Evolution of semi-major axis and resonant argument ΨSaturn 1:1 = λeff –λSaturn for a 2 μm particle. Here aSaturn 1:1 is for 2 μm particles. |
| In the text | |
|
Fig. 4 Evolution of semi-major axis and resonant argument Ψ3:4 for a 2 μm particle. Here a3:4 is for 2 μm particles. |
| In the text | |
|
Fig. 5 Evolution of semi-major axis and resonant argument Ψ4:3 for a 2 μm particle. Here a4:3 is for 2 μm particles. |
| In the text | |
|
Fig. 6 Eccentricity distribution of L4 asteroids (red) and Trojan dust of all sizes (blue). The black line denotes the eccentricity distribution of 2 μm particles. |
| In the text | |
|
Fig. 7 Distribution of the longitude of pericenter for L4 asteroids (red) and Trojan dust of all sizes (blue). The black line denotes the distribution of longitude of pericenter for 4 μm particles. |
| In the text | |
|
Fig. 8 Inclination distribution of the L4 asteroids (red) and Trojan dust of all sizes (blue). The black line denotes the inclination distribution of 1 μm particles. |
| In the text | |
|
Fig. 9 Evolution of inclination starting from an initial value i0. The parameter Δi is the integral of the contribution to di∕dt due to different perturbation forces acting on a 1 μm particle. |
| In the text | |
|
Fig. 10 Distribution of Tisserand parameter (relative to Jupiter) for L4 asteroids (red) and Trojan dust of all sizes (blue). The black line denotes the distribution of the Tisserand parameter for 2 μm particles. |
| In the text | |
Current usage metrics show cumulative count of Article Views (full-text article views including HTML views, PDF and ePub downloads, according to the available data) and Abstracts Views on Vision4Press platform.
Data correspond to usage on the plateform after 2015. The current usage metrics is available 48-96 hours after online publication and is updated daily on week days.
Initial download of the metrics may take a while.