Fig. 9
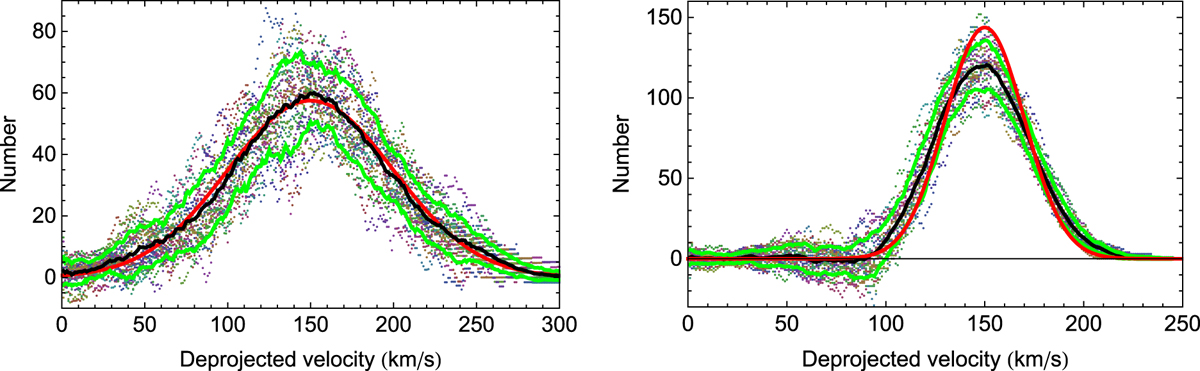
Deprojections by constant moving bins method of several realizations of a sample projected from an initial Gaussian distribution (Nv ≈ 1200 points, Ns = 25 realizations). We show the mean deprojected distribution (black curve) and the ± 1σ limits (green curves) compared with the initial distribution (red curve). In the left figure, the peak position is 150 km s−1 and its standard deviation 50 km s−1. The deprojection shows no bias with such a velocity peak width. In the right figure, the peak position is 150 km s−1 and the standard deviation 20 km s−1. The deprojection shows a bias with such a narrow velocity peak width. The deprojected velocity peak is too low by ≈ 12% and too wide by ≈20%, although the peak position is precisely recovered to within ≈1%.
Current usage metrics show cumulative count of Article Views (full-text article views including HTML views, PDF and ePub downloads, according to the available data) and Abstracts Views on Vision4Press platform.
Data correspond to usage on the plateform after 2015. The current usage metrics is available 48-96 hours after online publication and is updated daily on week days.
Initial download of the metrics may take a while.