Fig. 6
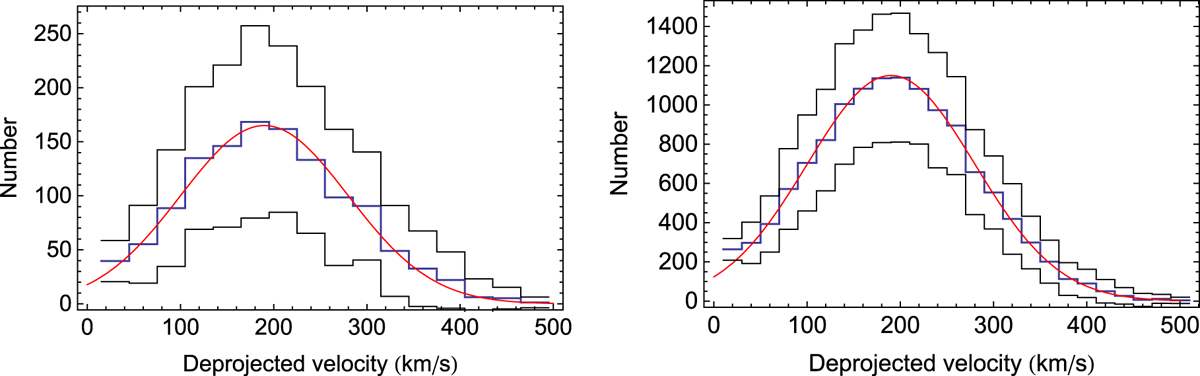
Numerical simulation of the intervelocity deprojection of a sample of 1200 pairs (left figure) and 13 000 pairs (right figure). The original 3D velocities have a Gaussian distribution of standard deviation σv = 90 km s−1 and peak velocity 190 km s−1 (cutoff on V = 0) [red curve]. We randomly project a random realization of this Gaussian distribution, then deproject it using the constant bin method with a bin of width 30 km s−1 (left figure) and 20 km s−1 (right figure, see text). The blue histogram is the mean result of 100 realizations of such a projection/deprojection and the black lines are the ± 1σ lines.
Current usage metrics show cumulative count of Article Views (full-text article views including HTML views, PDF and ePub downloads, according to the available data) and Abstracts Views on Vision4Press platform.
Data correspond to usage on the plateform after 2015. The current usage metrics is available 48-96 hours after online publication and is updated daily on week days.
Initial download of the metrics may take a while.