Fig. 4
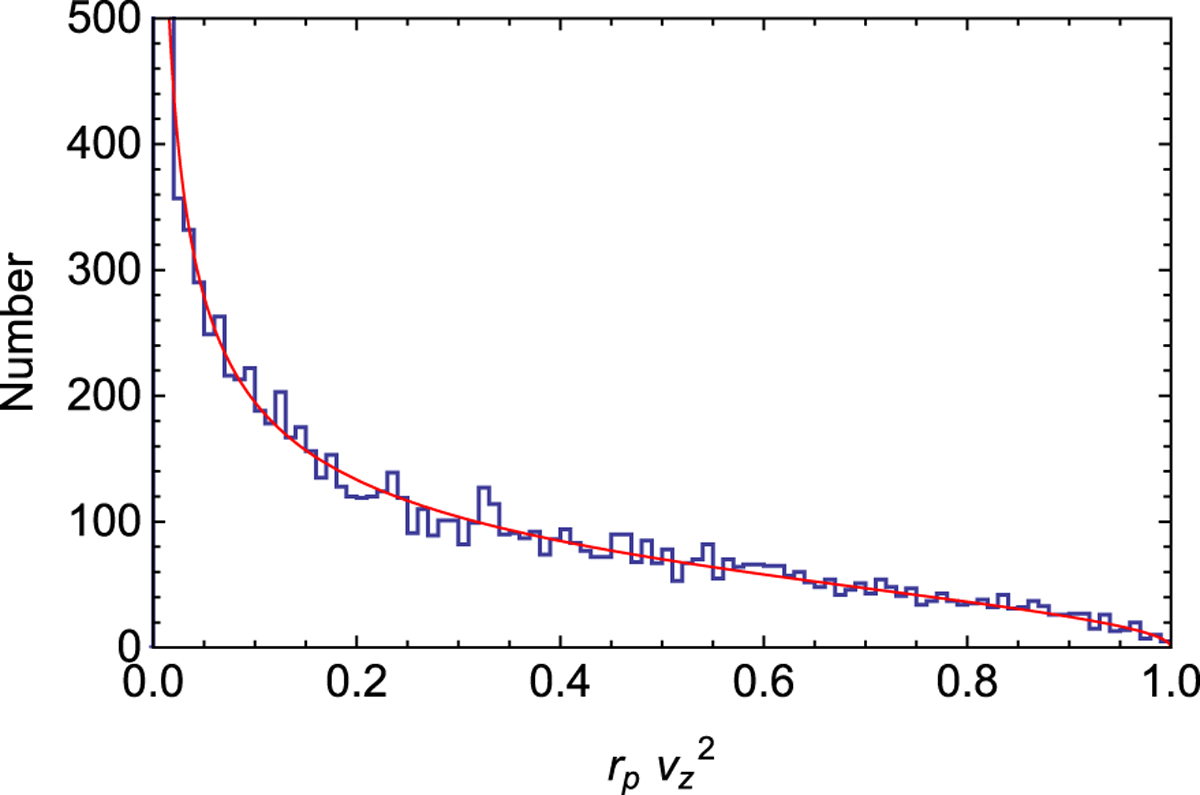
Analytical formula (see text) vs. numerical simulation of the density distribution of the product
![]() , where rp is the distance between pair members projected on the plane of the sky and vz
is their radial velocity difference. This combination of variable is essential for the statistical determination of the total mass of the pair. The product is plotted here for
r = 1 and v = 1, i.e., the plotted variable is actually
, where rp is the distance between pair members projected on the plane of the sky and vz
is their radial velocity difference. This combination of variable is essential for the statistical determination of the total mass of the pair. The product is plotted here for
r = 1 and v = 1, i.e., the plotted variable is actually ![]() . The number of simulated pairs is N ≈ 10 000. Within statistical fluctuations, the obtained probability distribution agrees well with the theoretical expectation (red line, Eq. (20)).
. The number of simulated pairs is N ≈ 10 000. Within statistical fluctuations, the obtained probability distribution agrees well with the theoretical expectation (red line, Eq. (20)).
Current usage metrics show cumulative count of Article Views (full-text article views including HTML views, PDF and ePub downloads, according to the available data) and Abstracts Views on Vision4Press platform.
Data correspond to usage on the plateform after 2015. The current usage metrics is available 48-96 hours after online publication and is updated daily on week days.
Initial download of the metrics may take a while.