Open Access
Fig. 16
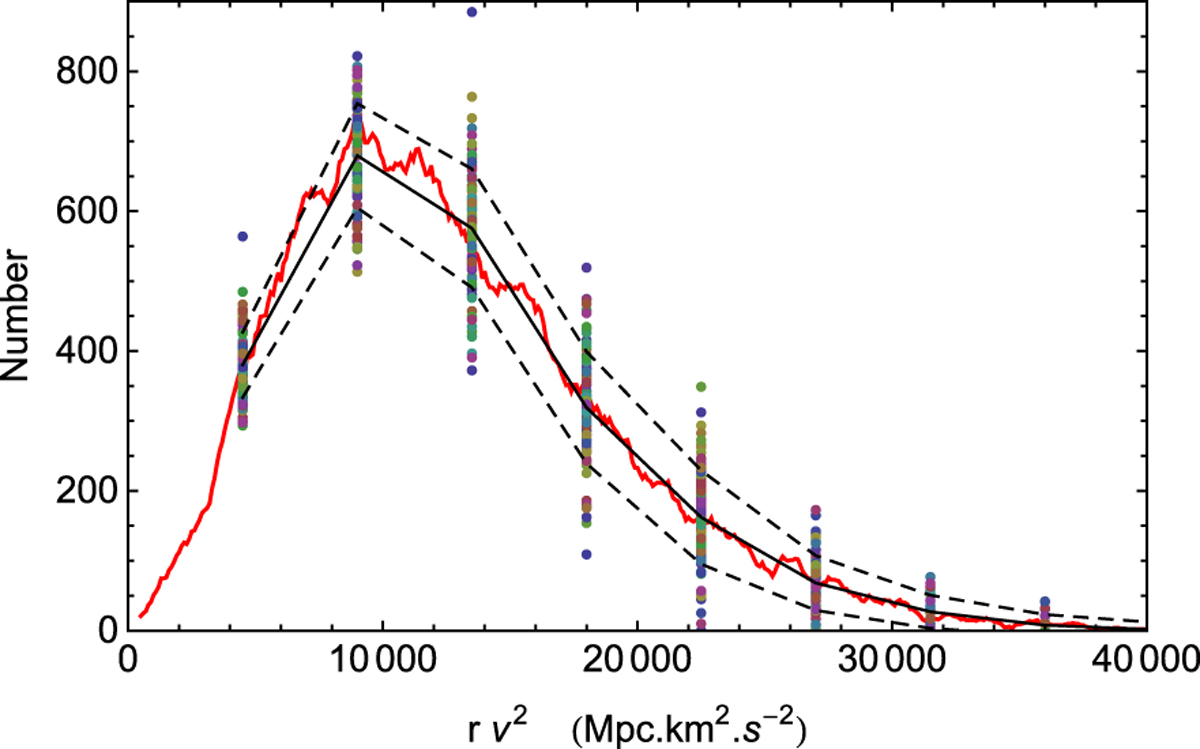
Simulation of 100 random projections of an initial distribution (given by the red curve, see Fig. 15), followed by their respective deprojections (individual points) using a 10 bin deprojection matrix (see text). This simulation allows us to establish the uncertainty of the deprojection method (dashed curves = ± 1σ).
Current usage metrics show cumulative count of Article Views (full-text article views including HTML views, PDF and ePub downloads, according to the available data) and Abstracts Views on Vision4Press platform.
Data correspond to usage on the plateform after 2015. The current usage metrics is available 48-96 hours after online publication and is updated daily on week days.
Initial download of the metrics may take a while.