Fig. 11
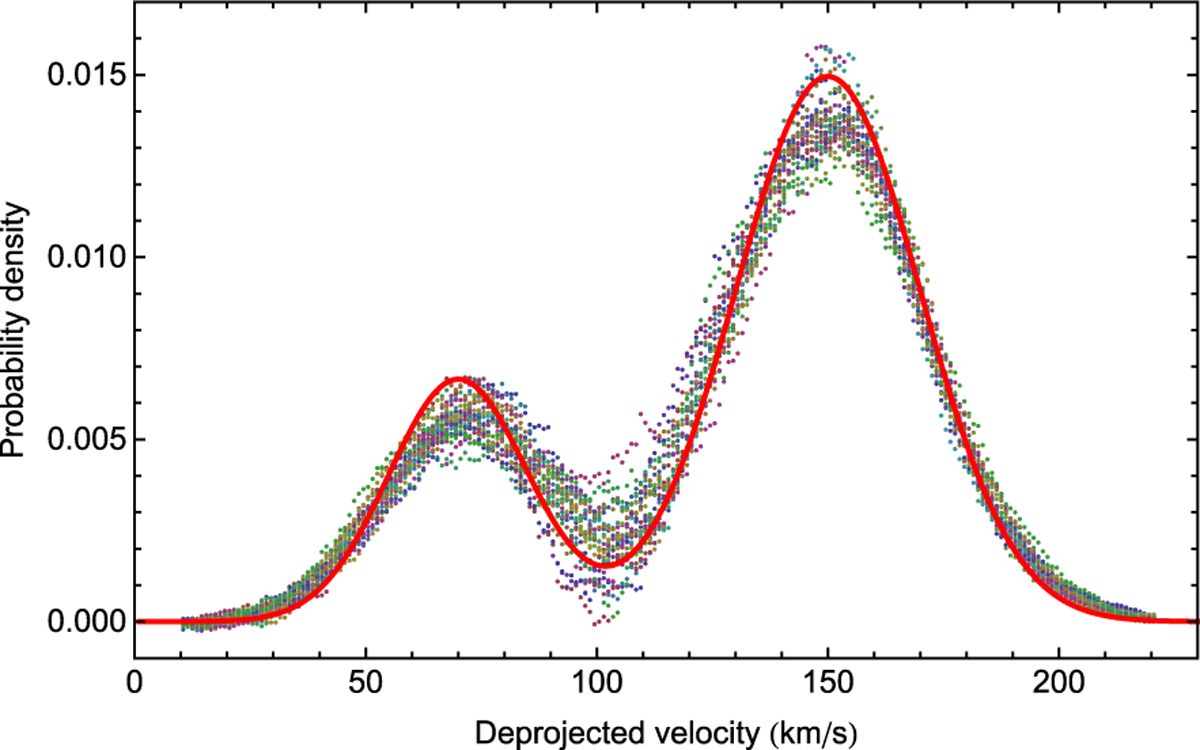
Deprojection by a varying moving bin. The bin width varies between 20 and 40 km s−1 dependingon the slope. The obtained distribution is finally smoothed out by a bin width 20 km s−1. We performed several realizations of a sample projected from an initial two-Gaussian peaks distribution with respective peak positions 70 and 150 km s−1 and standard deviations 15 and 20 km s−1 (Nv ≈ 12 000 points, Ns = 25 realizations). We show the initial distribution as a red continuous curve. Despite the narrowness of the peaks, the quality of the deprojection is very good since the two peaks and the intermediate hollow are clearly identified at their true positions.
Current usage metrics show cumulative count of Article Views (full-text article views including HTML views, PDF and ePub downloads, according to the available data) and Abstracts Views on Vision4Press platform.
Data correspond to usage on the plateform after 2015. The current usage metrics is available 48-96 hours after online publication and is updated daily on week days.
Initial download of the metrics may take a while.