Fig. 9.
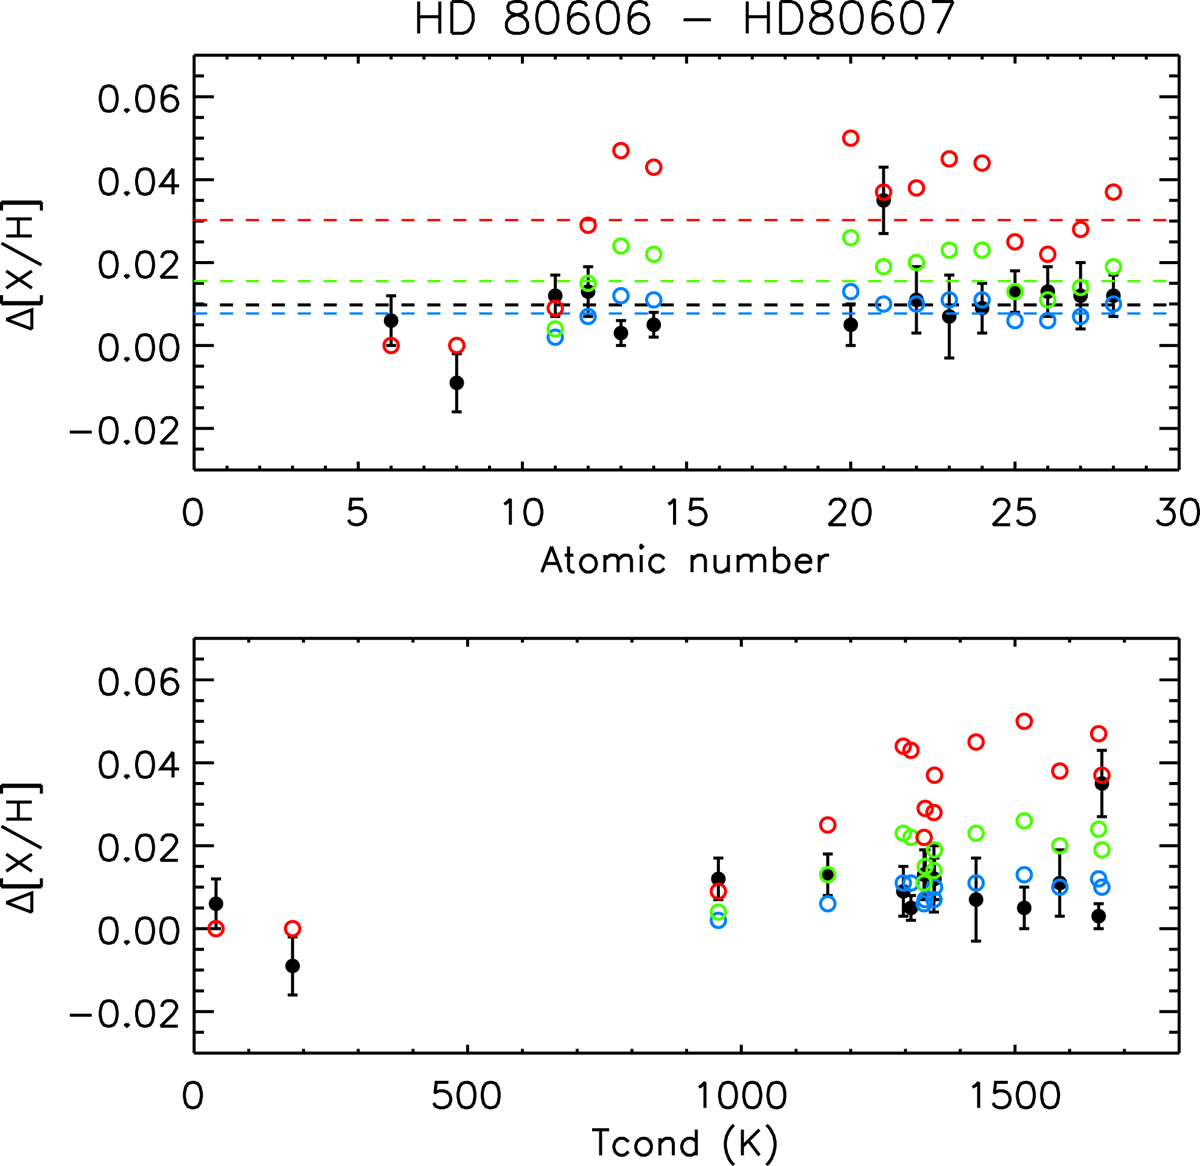
Differential abundances for (HD 80606 – HD 80607) as a function of atomic number (top panel) and Tcond (bottom panel). The black points represent our results. The blue, green, and red points are the model-predicted values corresponding to the effect of 2.5 MEarth, 5 MEarth and 10 MEarth, respectively (M16). The black, blue, green, and red dashed lines indicate the locations for the mean values of the corresponding data points.
Current usage metrics show cumulative count of Article Views (full-text article views including HTML views, PDF and ePub downloads, according to the available data) and Abstracts Views on Vision4Press platform.
Data correspond to usage on the plateform after 2015. The current usage metrics is available 48-96 hours after online publication and is updated daily on week days.
Initial download of the metrics may take a while.