Fig. 6.
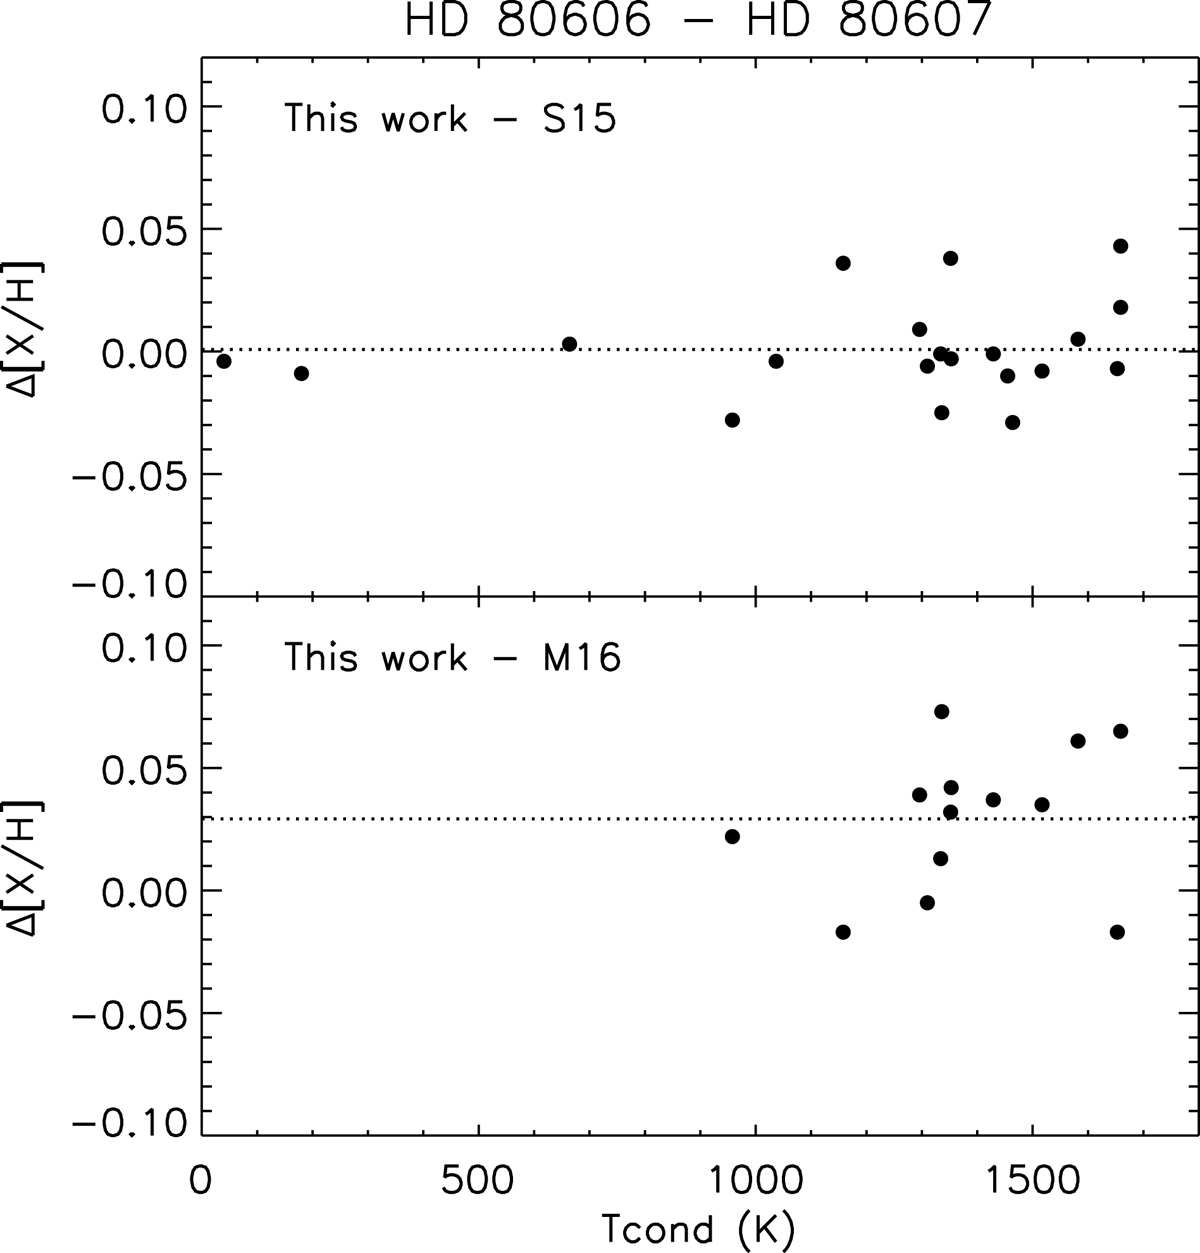
Comparison of the abundances from this work to the previous studies. Top panel: abundance differences in Δ[X/H] (HD 80606 – HD 80607) for elements in common in our work and the work by S15. The dashed lines indicate the location for the mean values of abundance differences. Bottom panel: similar as in the top panel, but showing the comparison between this work and the work by M16.
Current usage metrics show cumulative count of Article Views (full-text article views including HTML views, PDF and ePub downloads, according to the available data) and Abstracts Views on Vision4Press platform.
Data correspond to usage on the plateform after 2015. The current usage metrics is available 48-96 hours after online publication and is updated daily on week days.
Initial download of the metrics may take a while.