Fig. 4.
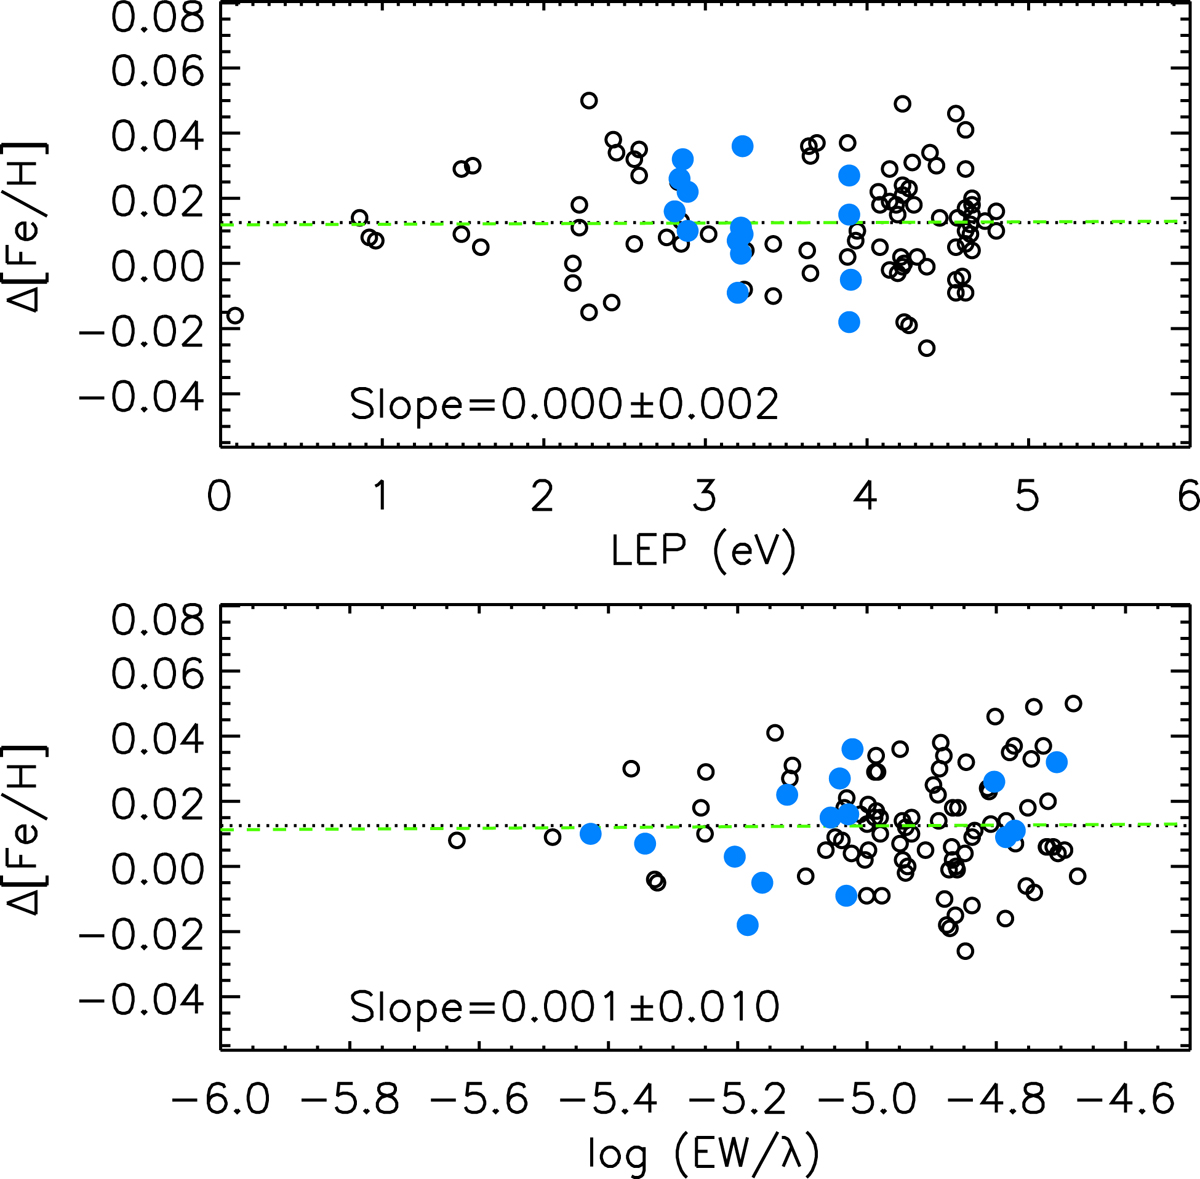
Example of a differential excitation and ionization balance. Top panel: Δ[Fe/H] of HD 80606 derived on a line-by-line basis with respect to HD 80607 as a function of LEP; open circles and blue filled circles represent Fe i and Fe ii lines, respectively. The black dotted line shows the location of the mean difference in [Fe/H], and the green dashed line represents the linear least-squares fit to the data. The coefficient for the slope in the best fit and its error is given in the panel. Bottom panel: same as in the top panel, but as a function of reduced EW.
Current usage metrics show cumulative count of Article Views (full-text article views including HTML views, PDF and ePub downloads, according to the available data) and Abstracts Views on Vision4Press platform.
Data correspond to usage on the plateform after 2015. The current usage metrics is available 48-96 hours after online publication and is updated daily on week days.
Initial download of the metrics may take a while.