Fig. 5
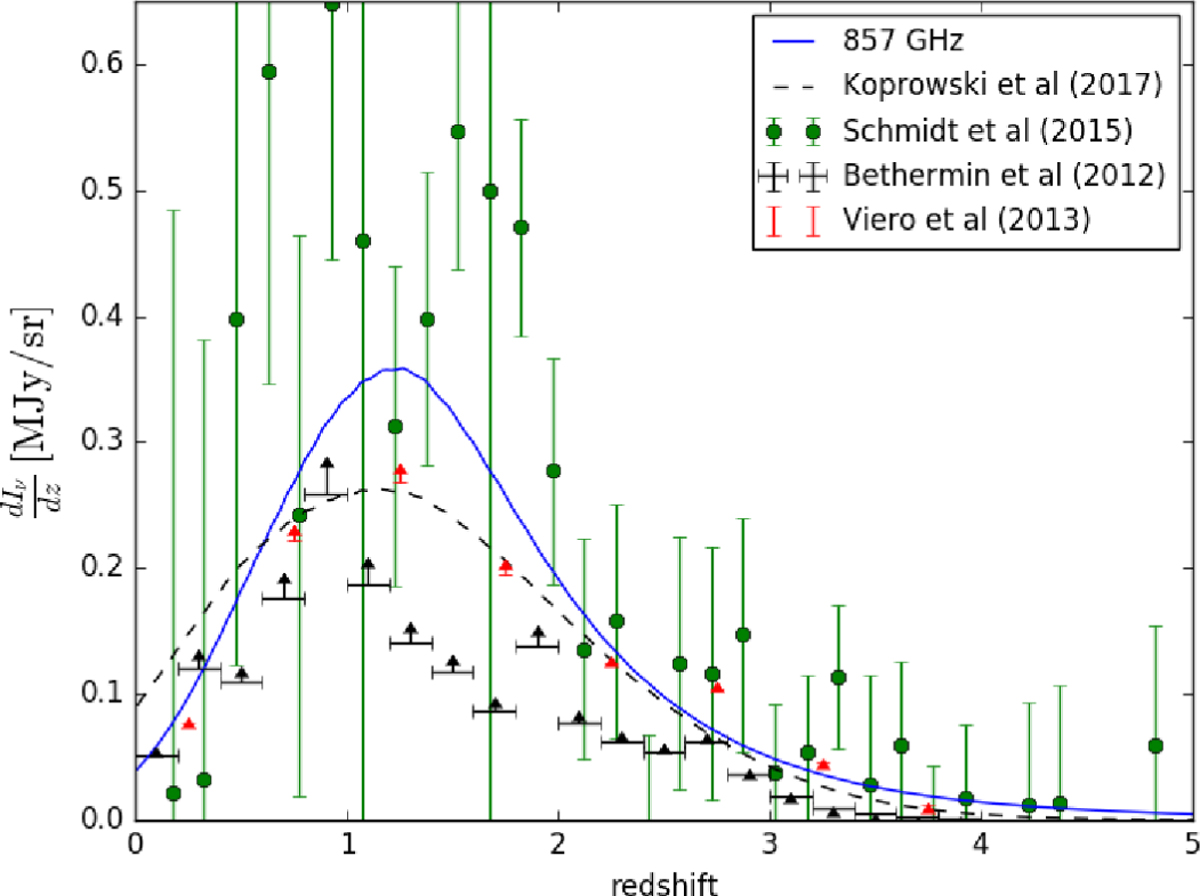
Expected CIB mean level redshift distribution at 857 GHz compared to observational constraints. The lower limits are from Béthermin et al. (2012b) and Viero et al. (2013). They are shown using black and red triangles, respectively. Measurements from Schmidt et al. (2015) are shown in green. The redshift distribution derived from Koprowski et al. (2017) SFRD constraints is shown with the black dashed line.
Current usage metrics show cumulative count of Article Views (full-text article views including HTML views, PDF and ePub downloads, according to the available data) and Abstracts Views on Vision4Press platform.
Data correspond to usage on the plateform after 2015. The current usage metrics is available 48-96 hours after online publication and is updated daily on week days.
Initial download of the metrics may take a while.