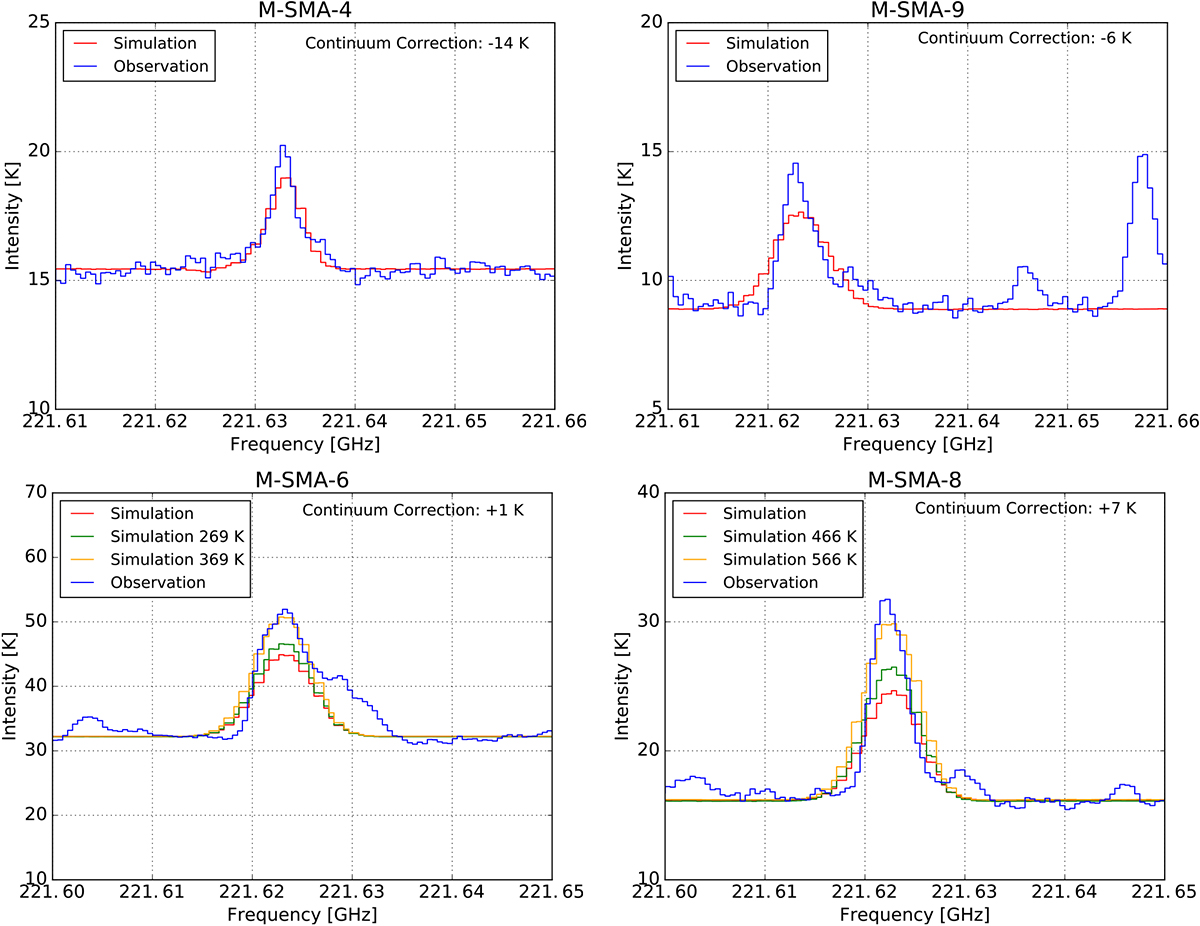
Fig. 9

Spectra of the vibrationally excited transition ν8 = 1, J = 12−11, K = 1 − (−1) taken from the center of different cores. The blue solid line shows the observational data, while the red solid lines show the simulated data when the gas temperature equals the dust temperature. The bottom panels also show the simulated spectra after modifying the gas temperature by 50 K (green) and 150 GHz (yellow), as discussed in Sect. 6.3. The continuum correction necessary to match the continuum level of the observation and simulation is indicated in the top right corner of each panel.
Current usage metrics show cumulative count of Article Views (full-text article views including HTML views, PDF and ePub downloads, according to the available data) and Abstracts Views on Vision4Press platform.
Data correspond to usage on the plateform after 2015. The current usage metrics is available 48-96 hours after online publication and is updated daily on week days.
Initial download of the metrics may take a while.


