Fig. 7
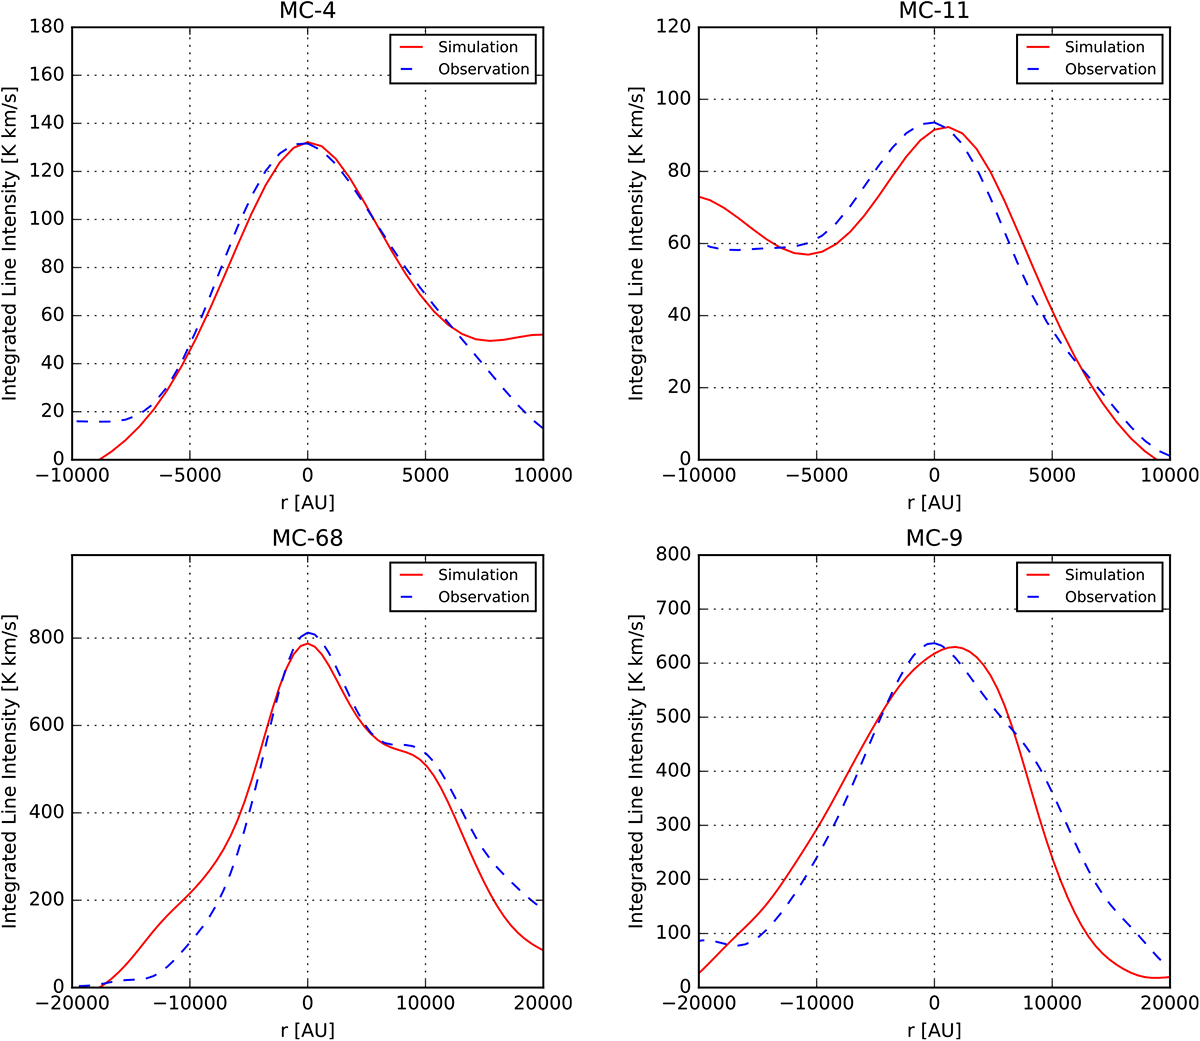
Radial profiles of the integrated line intensity for the CH3CN J = 12−11, K = 3 transition. The radial profiles proceed from west to east and r = 0 corresponds to the center of the considered molecular centers. The first two profiles (MC-4 and MC-11) are taken from the newly introduced molecular centers in the northern region (cf. Fig. 4). The third profile (MC-68) is taken from the molecular center located between the continuum cores M-SMA-6 and M-SMA-8. The last profile (MC-9) is centered around the molecular center south to the continuum core M-SMA-9. In all panels the blue dashed line shows the observational data, whereas the red solid line corresponds to the simulated data.
Current usage metrics show cumulative count of Article Views (full-text article views including HTML views, PDF and ePub downloads, according to the available data) and Abstracts Views on Vision4Press platform.
Data correspond to usage on the plateform after 2015. The current usage metrics is available 48-96 hours after online publication and is updated daily on week days.
Initial download of the metrics may take a while.