Fig. 6
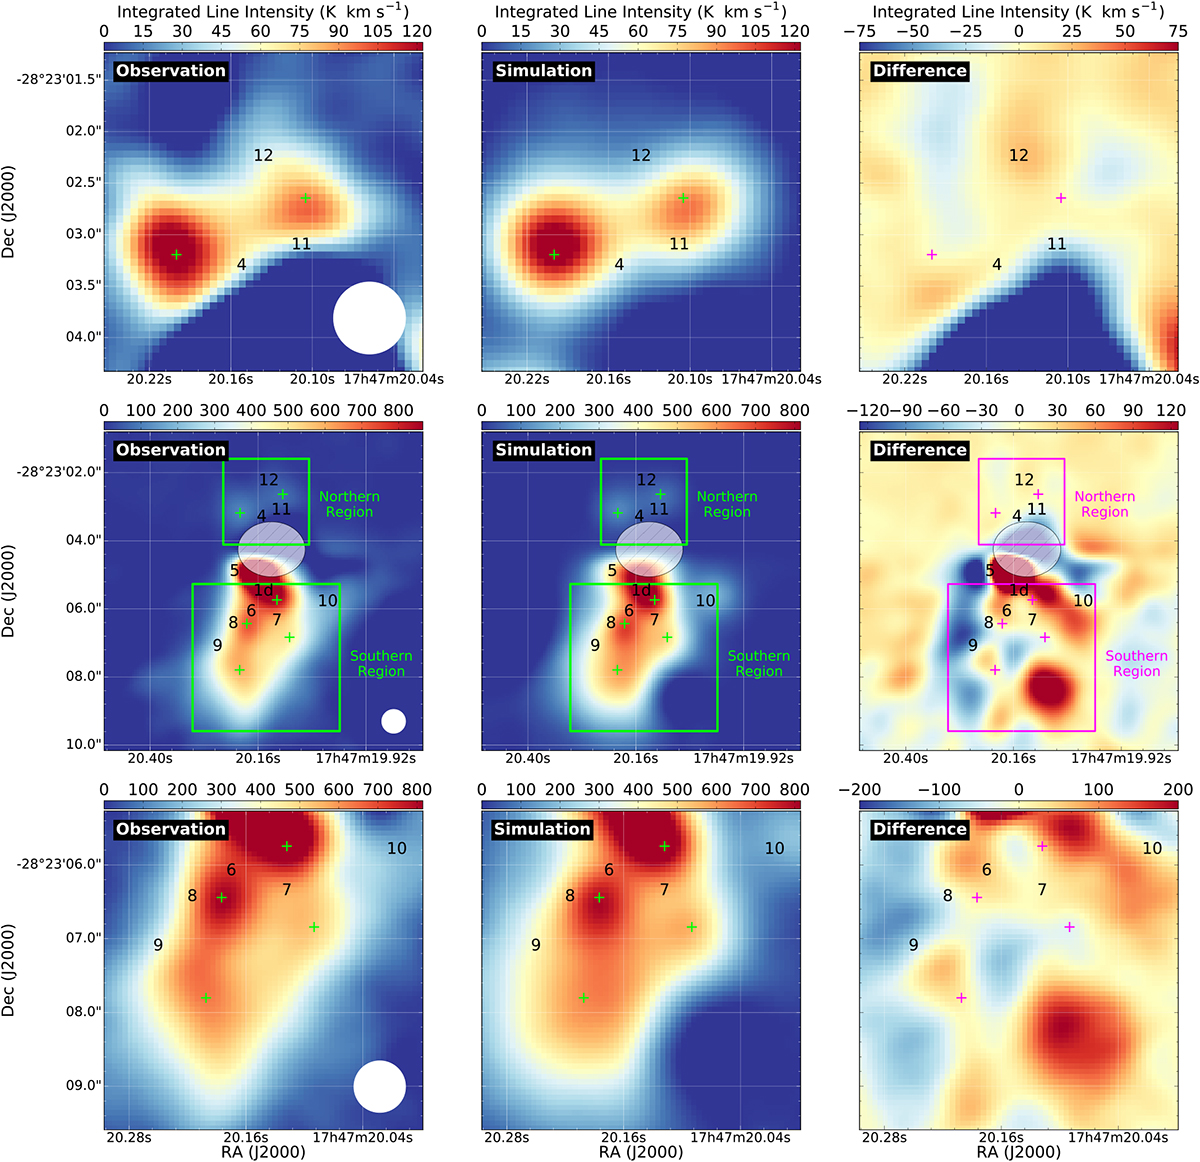
Integrated intensity maps (or zeroth-order moment maps) of the observational (left column) and simulated (middle column) data for the CH3CN J = 12−11, K = 3 transition. The right panels show the difference between the observational and the simulated data. The center row shows the entire Sgr B2(M) complex except for the central region, which is masked out with a transparent hatched area. The green and magenta boxes indicate the zoomed-in regions that are depicted in the top row (northern part of Sgr B2(M)) and the bottom row (southern part of Sgr B2(M)). As in previous figures, the black numbers indicate the position of the dust cores, whereas the green and magenta crosses depict the positions of the molecular centers (see Table A.1).
Current usage metrics show cumulative count of Article Views (full-text article views including HTML views, PDF and ePub downloads, according to the available data) and Abstracts Views on Vision4Press platform.
Data correspond to usage on the plateform after 2015. The current usage metrics is available 48-96 hours after online publication and is updated daily on week days.
Initial download of the metrics may take a while.