Fig. 5
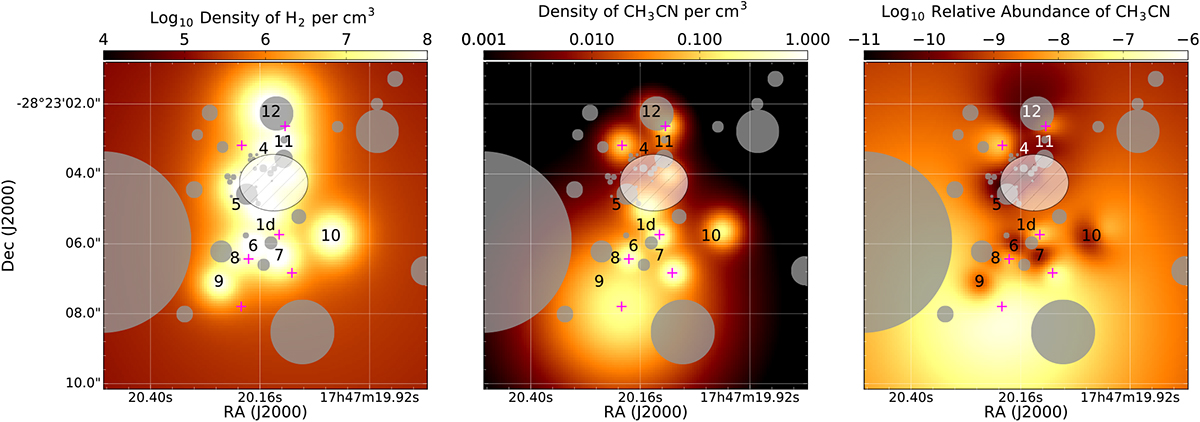
Maps of the H2 (left panel) and CH3CN (middle panel) density and relative abundance of CH3CN with respect to H2 (right panel). The black numbers show the position of the dust cores, and the magenta crosses indicate the position of the newly introduced molecular centers, as shown in Fig. 4 (see also Table A.1). The gray circles indicate the positions and extent of H II regions, where the density of H2 and CH3CN is zero. The central region is masked out (transparent hatched area) as the CH3 CN transitions in this region cannot be reproduced well with the model (see Sect. 6.6).
Current usage metrics show cumulative count of Article Views (full-text article views including HTML views, PDF and ePub downloads, according to the available data) and Abstracts Views on Vision4Press platform.
Data correspond to usage on the plateform after 2015. The current usage metrics is available 48-96 hours after online publication and is updated daily on week days.
Initial download of the metrics may take a while.