Fig. 4
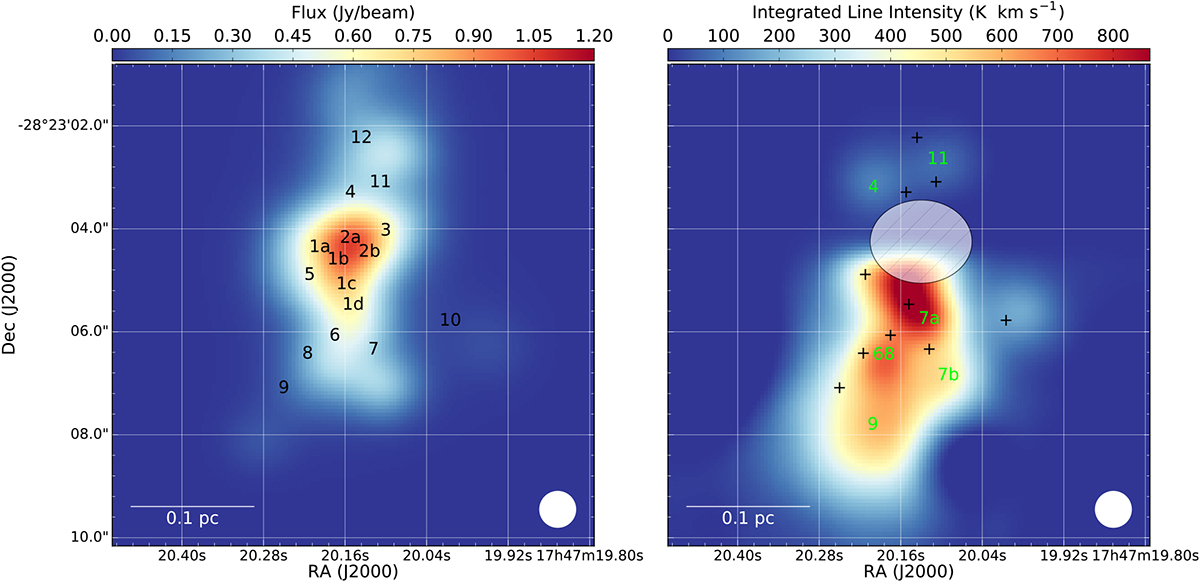
Left panel: synthetic map of the continuum emission of Sgr B2(M) at 220 GHz. The black numbers indicate the positions of the dust cores from the physical model introduced in Paper I. Right panel: integrated line intensity map of the J = 12−11, K = 3 transition predicted by the model. The black crosses indicate the positions of the dust cores as shown in the right panel. The green numbers indicate the position of the newly introduced molecular centers (see Sect. 5.3). The central region is masked out by the transparent hatched area as the CH3 CN emission in this region could not be reproduced by the model (see Sect. 6.6).
Current usage metrics show cumulative count of Article Views (full-text article views including HTML views, PDF and ePub downloads, according to the available data) and Abstracts Views on Vision4Press platform.
Data correspond to usage on the plateform after 2015. The current usage metrics is available 48-96 hours after online publication and is updated daily on week days.
Initial download of the metrics may take a while.