Fig. 3
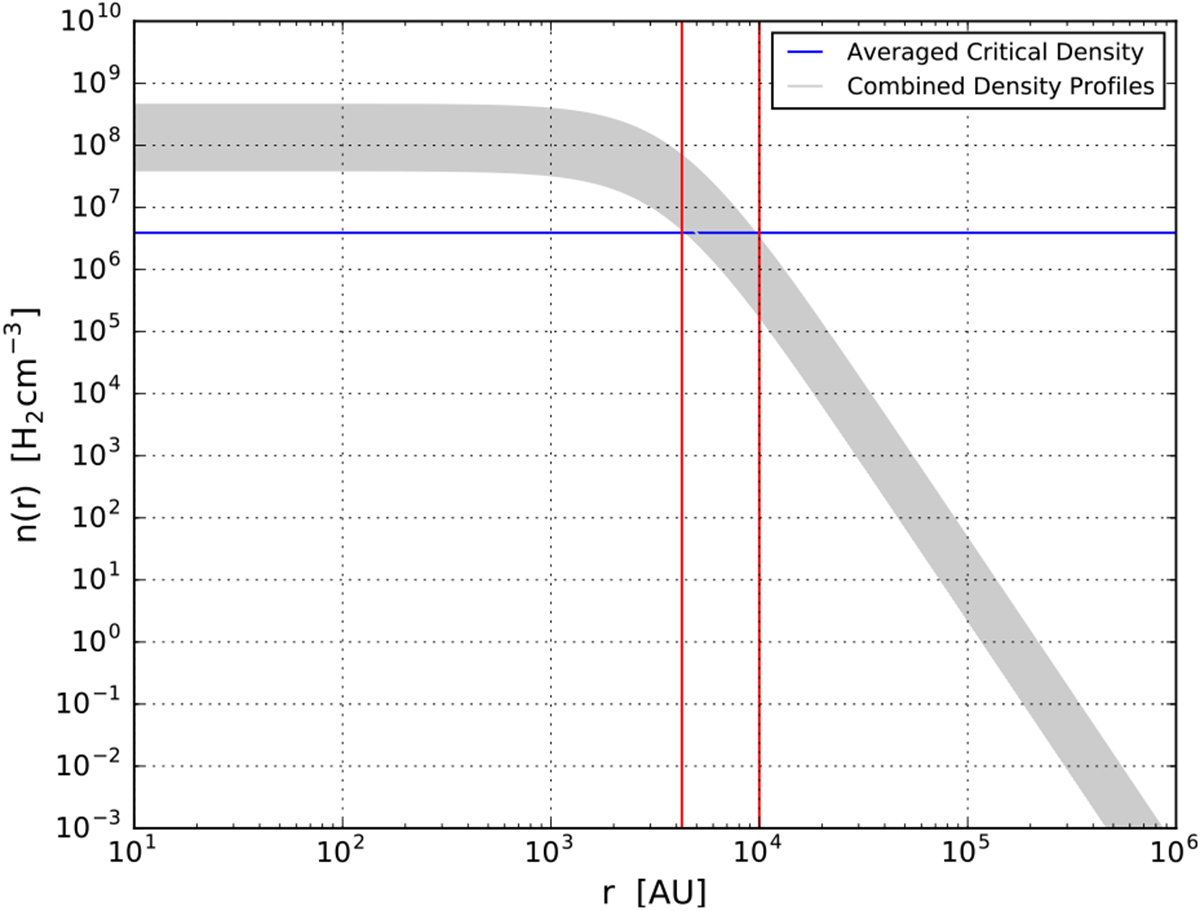
Combined density profile (grey area) of all the dense cores included in the model of Sgr B2(M). The average critical density of the transitions listed in Table 1 is shown as an horizontal blue line. The vertical red lines at 4.25 × 10³ and 104 au indicate up to which distance from the center of the cores the LTE approximation is valid.
Current usage metrics show cumulative count of Article Views (full-text article views including HTML views, PDF and ePub downloads, according to the available data) and Abstracts Views on Vision4Press platform.
Data correspond to usage on the plateform after 2015. The current usage metrics is available 48-96 hours after online publication and is updated daily on week days.
Initial download of the metrics may take a while.