Fig. B.4
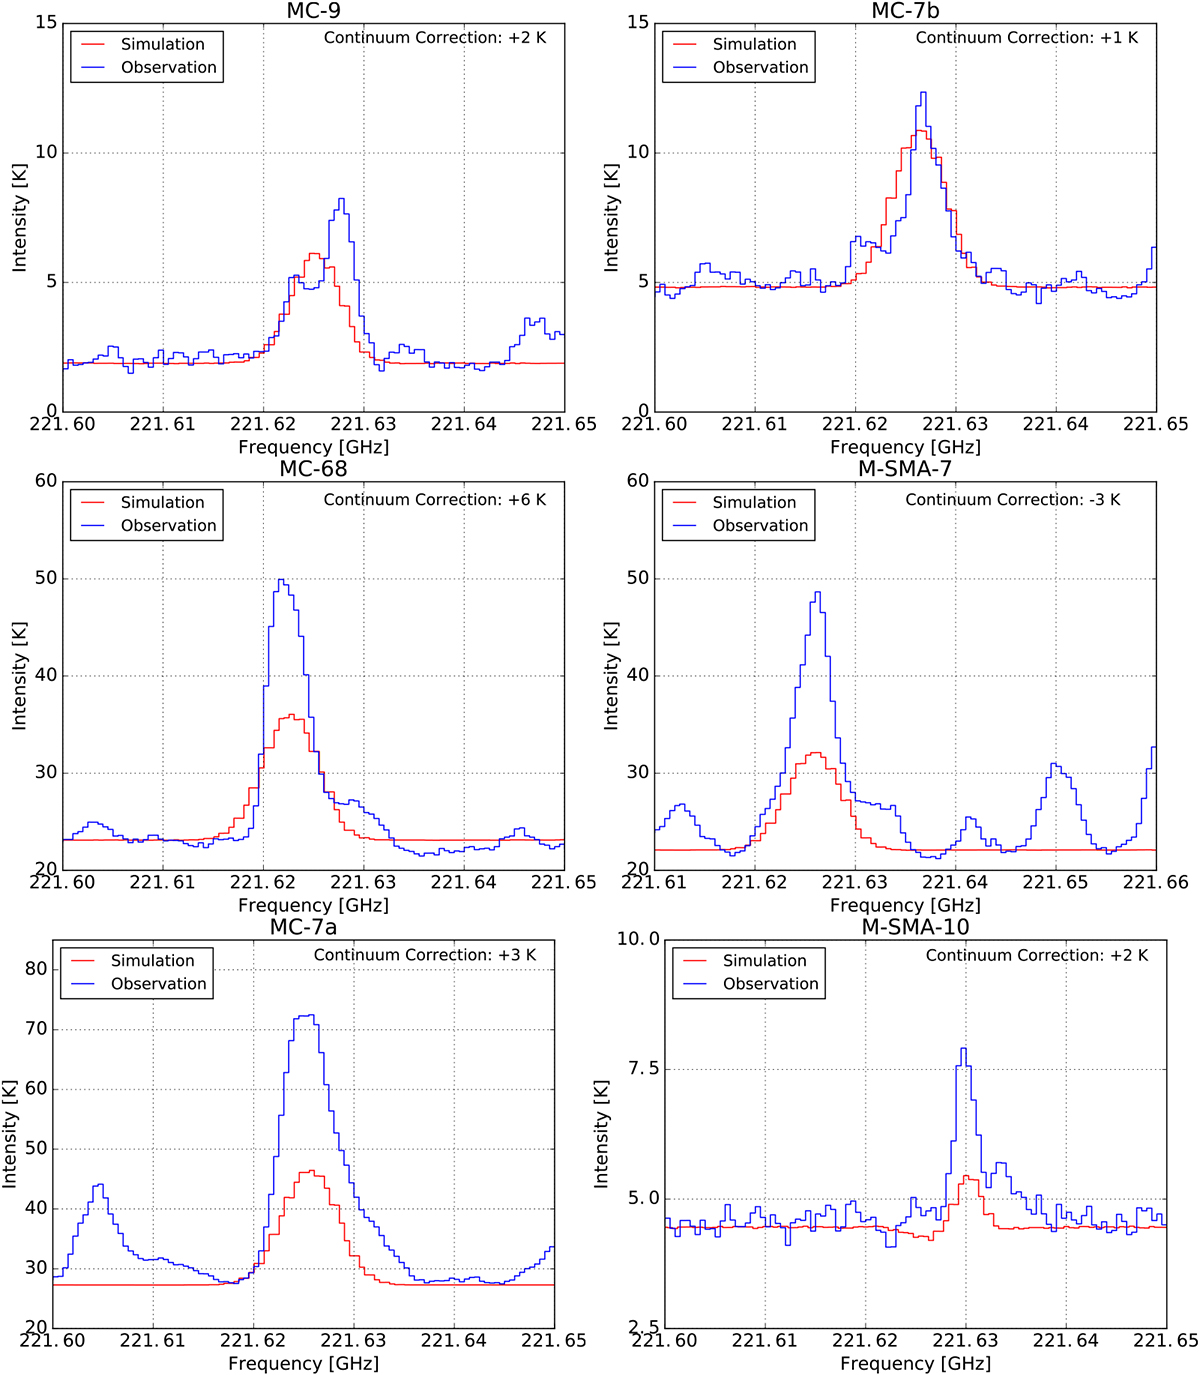
Spectra of the observational (in blue) and simulated (in red) data extracted from the position of different cores and molecular centers for the vibrationally excited transition CH3 CN ν8 = 1, J = 12−11, K = 1 − (−1). The spectra are arranged according to the position of the corresponding cores and molecular centers along a south–north direction, starting from the most southern core. The name of the core and molecular center is shown for each panel. The continuum correction necessary to match the continuum level of the observation and simulation is indicated in the top right corner of each panel.
Current usage metrics show cumulative count of Article Views (full-text article views including HTML views, PDF and ePub downloads, according to the available data) and Abstracts Views on Vision4Press platform.
Data correspond to usage on the plateform after 2015. The current usage metrics is available 48-96 hours after online publication and is updated daily on week days.
Initial download of the metrics may take a while.