Fig. 15
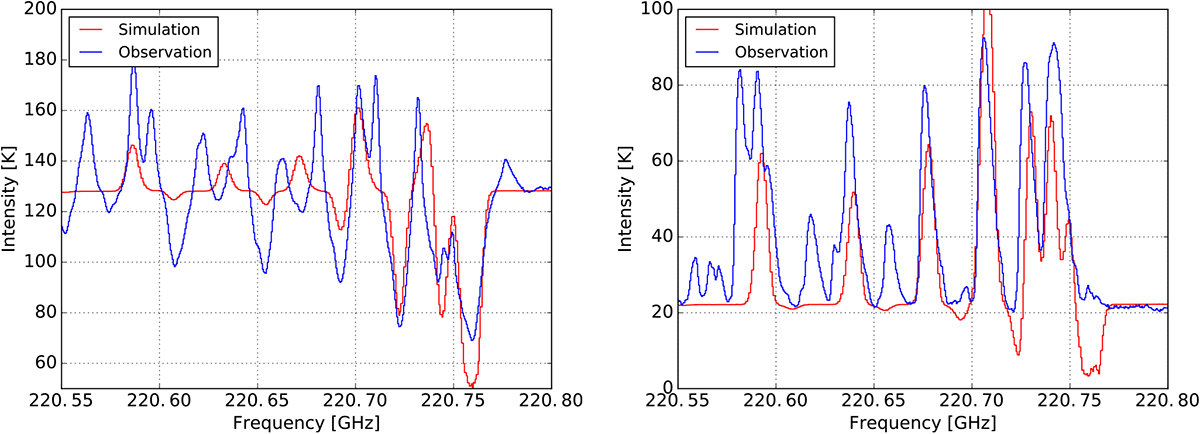
Spectra of the model after including the large-scale envelope with a CH3 CN abundance of 10−7. The left panel shows a spectrum towards the center where absorption features associated with the low-K transitions are reproduced. The right panel shows a spectrum towards the southern location MC-68. This model predicts absorptions for the low-K transitions that are not visible in the observational data.
Current usage metrics show cumulative count of Article Views (full-text article views including HTML views, PDF and ePub downloads, according to the available data) and Abstracts Views on Vision4Press platform.
Data correspond to usage on the plateform after 2015. The current usage metrics is available 48-96 hours after online publication and is updated daily on week days.
Initial download of the metrics may take a while.