Free Access
Fig. 14
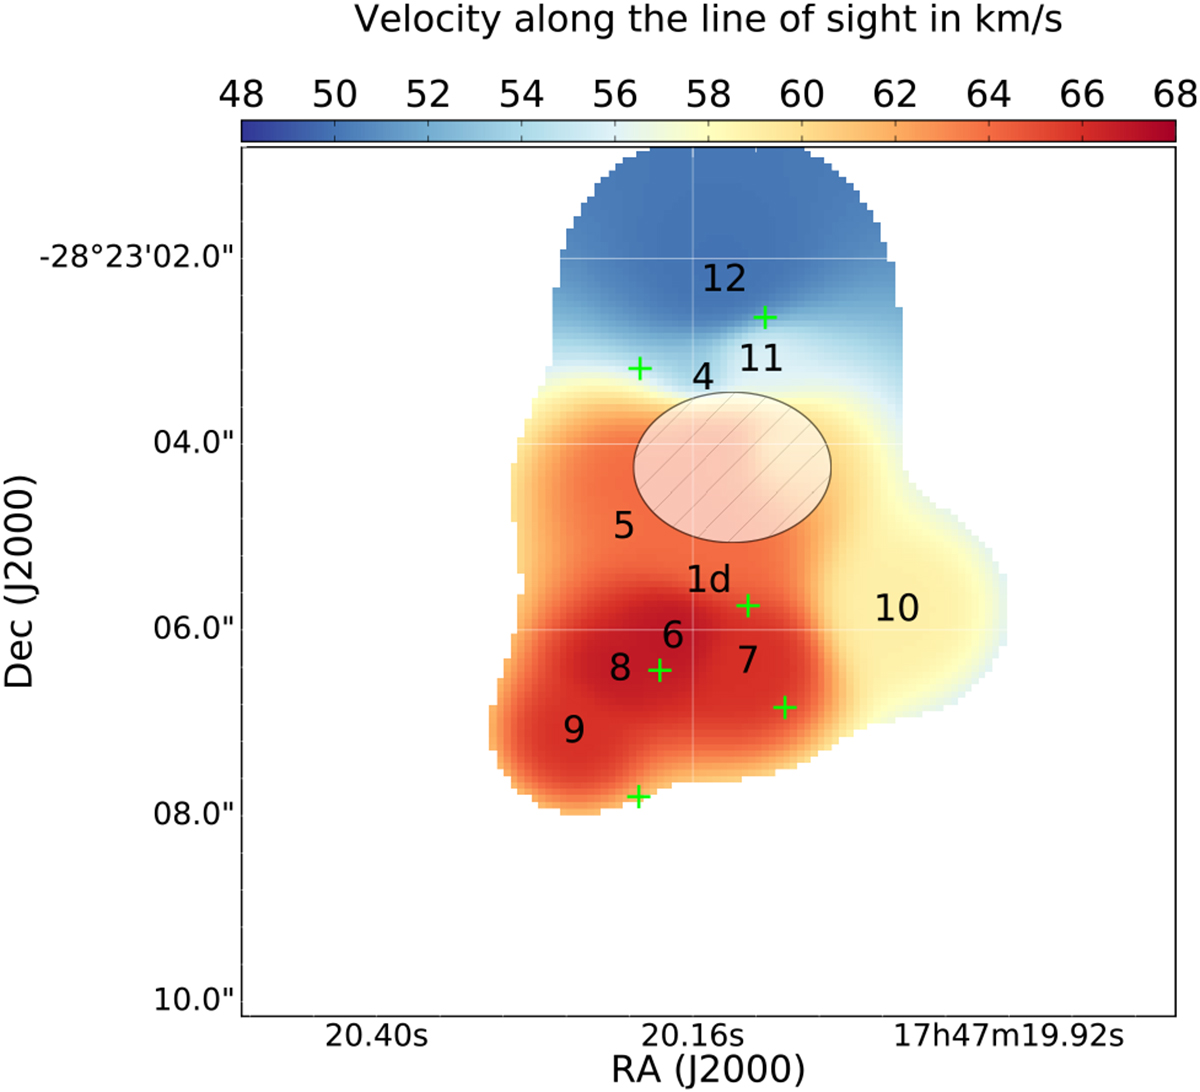
Distribution of the velocity along the line of sight at the z = 0 plane, as derived from the model of Sgr B2(M). The central region is masked out by a transparent, hatched area. The black numbers and green crosses indicate the dense cores and molecular centers, respectively, as in Fig. 4.
Current usage metrics show cumulative count of Article Views (full-text article views including HTML views, PDF and ePub downloads, according to the available data) and Abstracts Views on Vision4Press platform.
Data correspond to usage on the plateform after 2015. The current usage metrics is available 48-96 hours after online publication and is updated daily on week days.
Initial download of the metrics may take a while.