Fig. 13
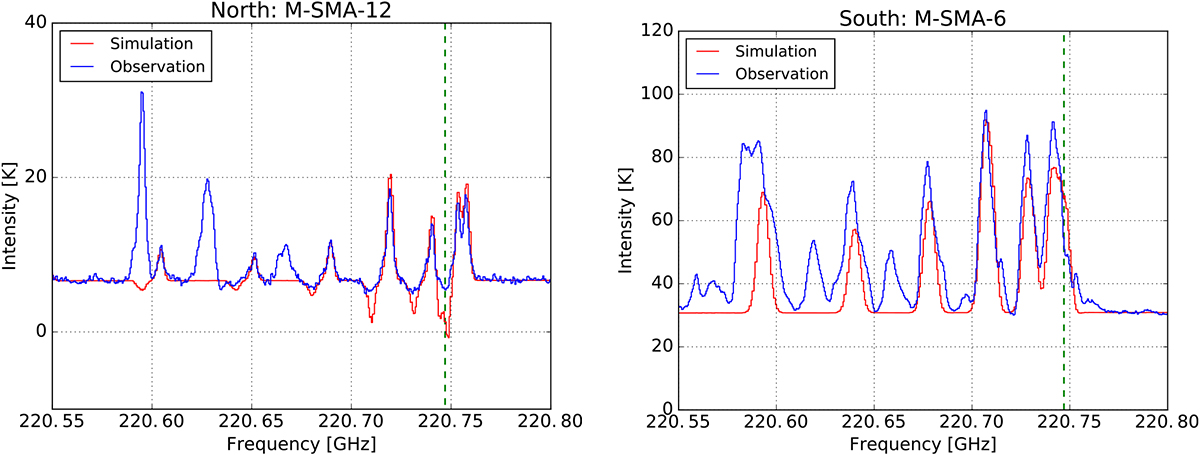
Spectra taken from a northern (M-SMA-12) and a southern (M-SMA-6) core to illustrate the shift in frequency due to the velocity component along the line of sight. The green, dashed vertical lines indicate the rest frequency of the J = 12−11, K = 0 transition. The core M-SMA-12 exhibits a blue-shifted velocity along the line of sight of 50 km s−1, while core M-SMA-6 has a red-shifted velocity of 67 km s−1. The systemic velocity of Sgr B2(M) is about 64 km s−1.
Current usage metrics show cumulative count of Article Views (full-text article views including HTML views, PDF and ePub downloads, according to the available data) and Abstracts Views on Vision4Press platform.
Data correspond to usage on the plateform after 2015. The current usage metrics is available 48-96 hours after online publication and is updated daily on week days.
Initial download of the metrics may take a while.