Free Access
Fig. 10
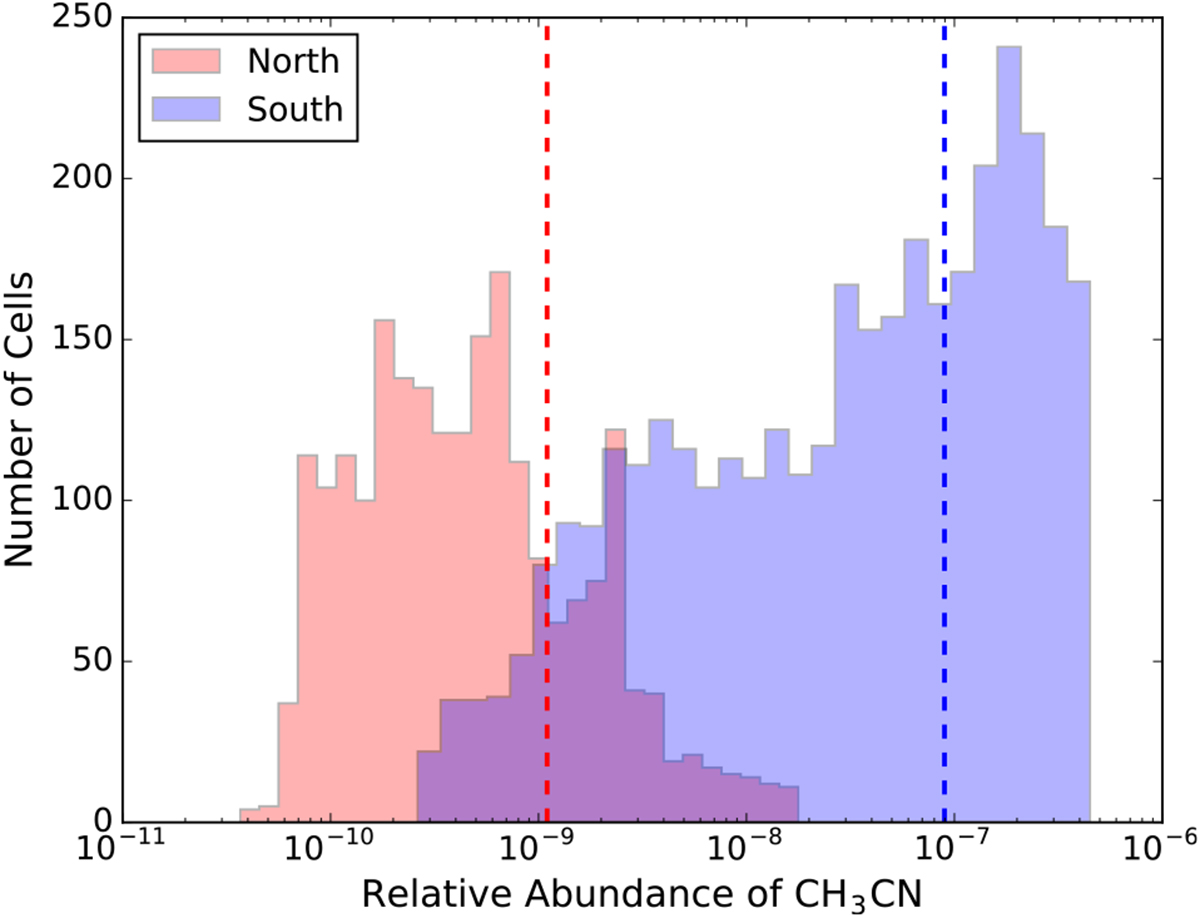
Histogram of the distribution of the relative abundance of CH3CN for the northern (red) and southern (blue) region of Sgr B2(M). For this purpose cubes were placed around the northern and southern parts, which were composed of cells with side lengths of 695 AU. The vertical lines indicate the averaged values.
Current usage metrics show cumulative count of Article Views (full-text article views including HTML views, PDF and ePub downloads, according to the available data) and Abstracts Views on Vision4Press platform.
Data correspond to usage on the plateform after 2015. The current usage metrics is available 48-96 hours after online publication and is updated daily on week days.
Initial download of the metrics may take a while.