Fig. 1
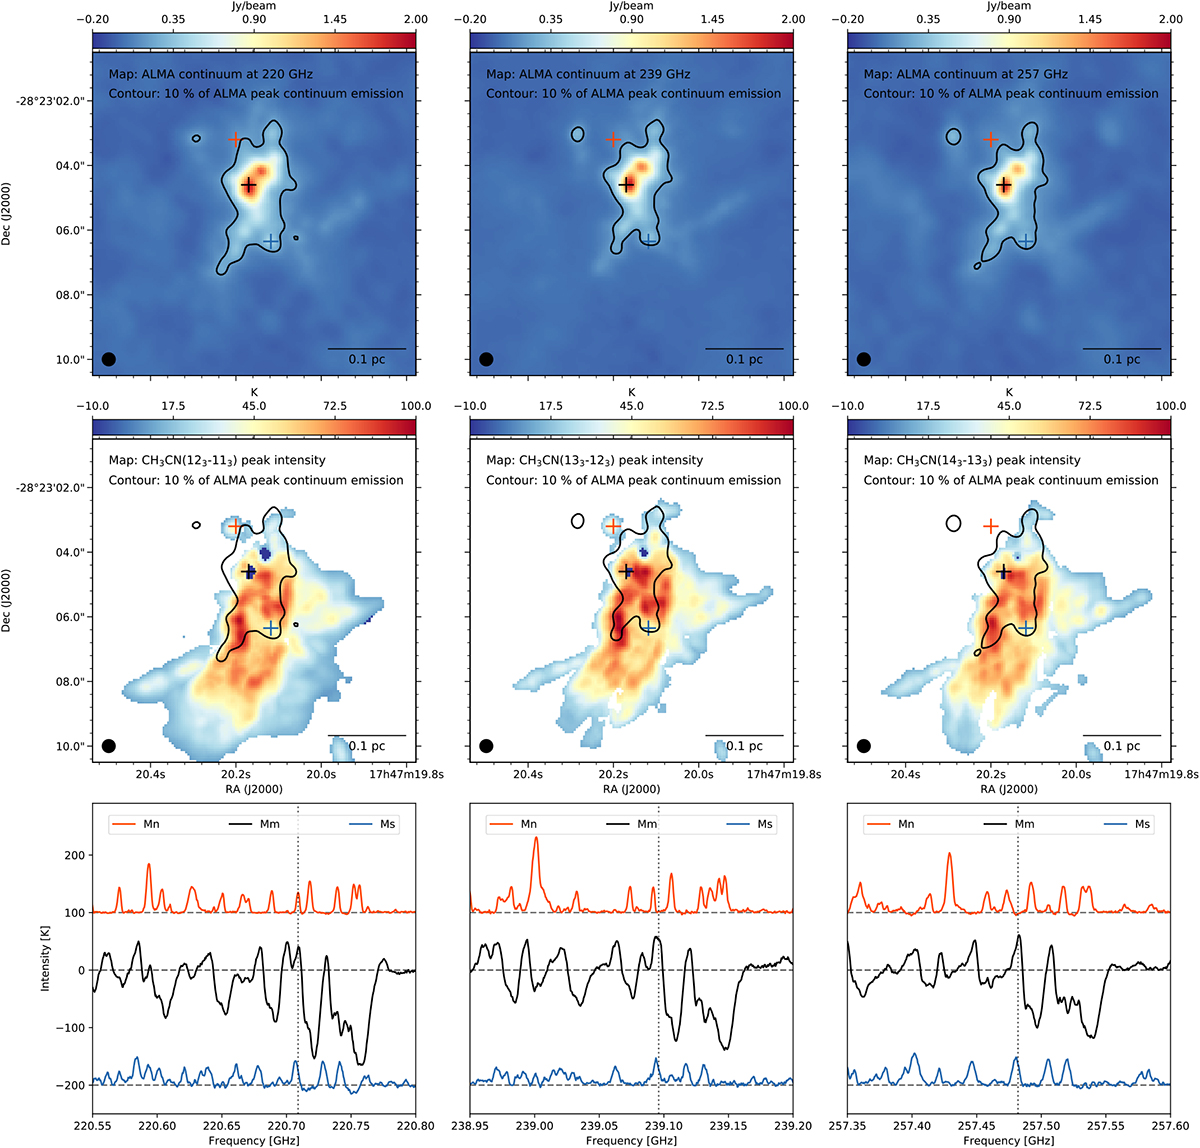
Top panels: continuum maps towards Sgr B2(M) determined using STATCONT (Sánchez-Monge et al. 2018) at the frequencies of the spectral windows that cover the three CH3 CN ground state transitions: 220 GHz (left), 239 GHz (center), and 257 GHz (right). The black contour shows the 10% level of the continuum emission peak. Middle panels: intensity peak maps of different CH3 CN transitions: J = 12− 11, K = 3 (left), J = 13−12, K = 3 (center), and J = 14−13, K = 3 (right). The intensity peak maps are obtained from a narrow frequency range around the frequency indicated with a vertical dotted line in the bottom panels. The black contour depicts the 10% level of the continuum emission, as in the top panels. Bottom panels: spectra extracted at three different positions marked with crosses in the top and middle panels. The selected positions are located in the north (Mn, in red), in the center of the region associated with the brightest continuum peak (Mm, in black), and towards the south (Ms, in blue). To enhance the clarity, we shifted the red spectrum by +100 K and the blue spectrum by −200 K. The relativecontinuum levels are indicated by the dashed gray lines.
Current usage metrics show cumulative count of Article Views (full-text article views including HTML views, PDF and ePub downloads, according to the available data) and Abstracts Views on Vision4Press platform.
Data correspond to usage on the plateform after 2015. The current usage metrics is available 48-96 hours after online publication and is updated daily on week days.
Initial download of the metrics may take a while.