Fig. 9
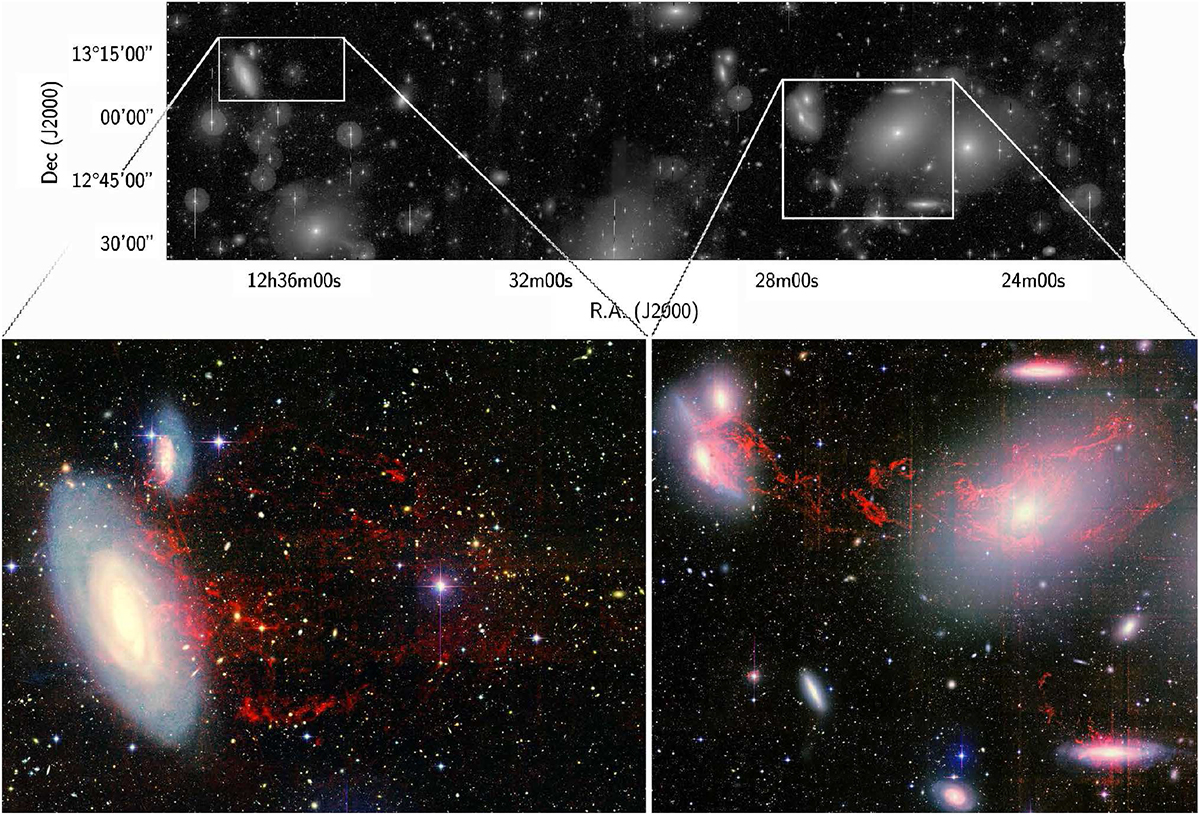
Upper panel: g-band image of the 4 × 1 deg2 (corresponding to 1.1 × 0.3 Mpc2) strip of the core of the cluster north of M87. The lower panels are a magnified view of the boxed regions marked on the upper panel. They show the pseudo-colour images of NGC 4569 and IC 3583 (lower-left panel) and of the NGC 4438-N4388-M86 complex (lower-right panel) obtained combining the NGVS optical u and g in the blue channel, the r and NB in the green, and the i and the continuum-subtracted Hα in the red.
Current usage metrics show cumulative count of Article Views (full-text article views including HTML views, PDF and ePub downloads, according to the available data) and Abstracts Views on Vision4Press platform.
Data correspond to usage on the plateform after 2015. The current usage metrics is available 48-96 hours after online publication and is updated daily on week days.
Initial download of the metrics may take a while.