Open Access
Fig. 6
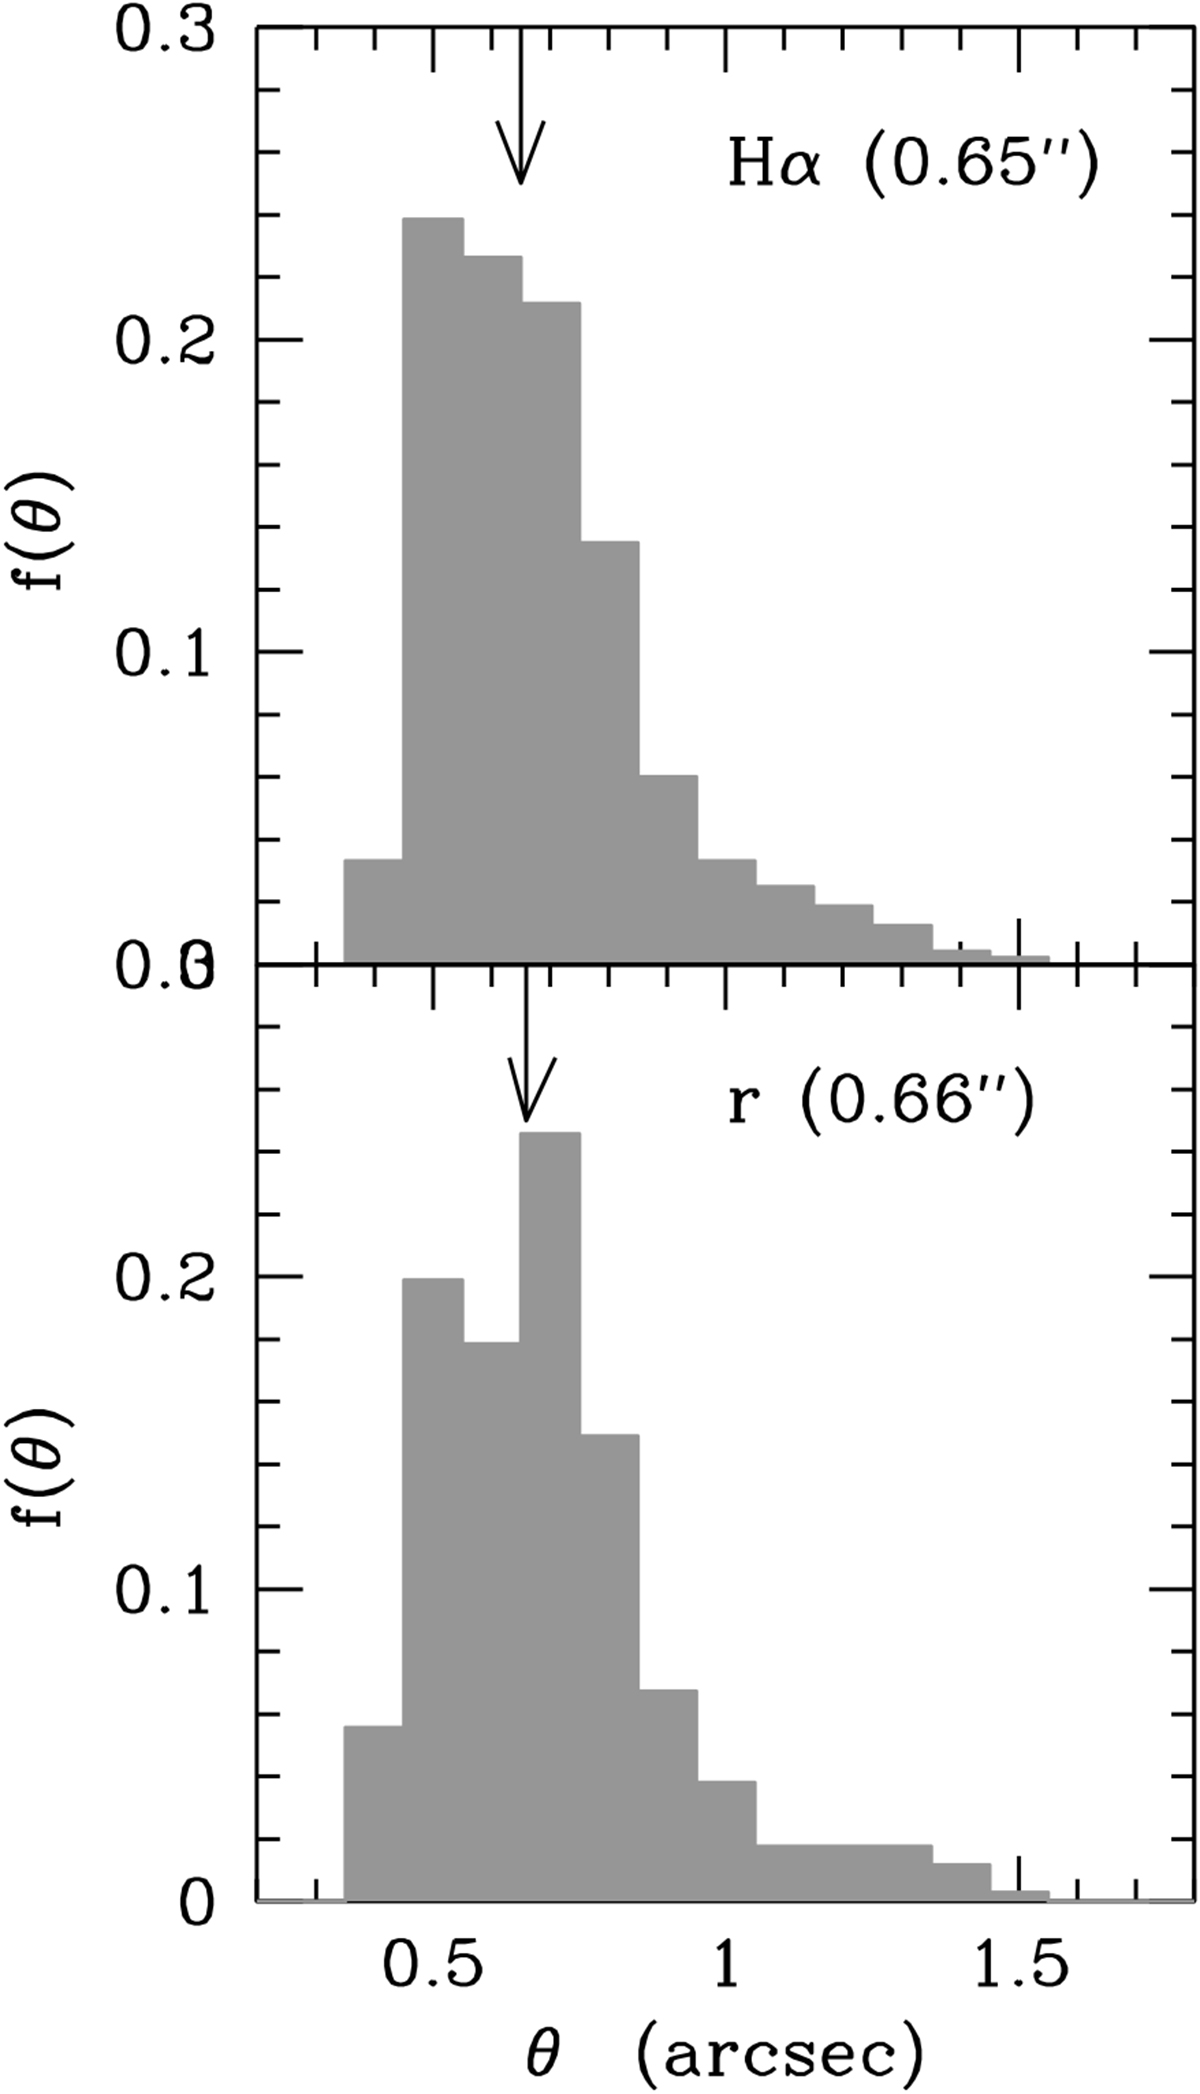
Seeingdistribution in the Hα NB (upper panel) and r-band (lower panel) filters determined from the single images gathered during the 2017A observing campaign and in the 2015 and 2016 pilot observations. The vertical arrows indicate the median values.
Current usage metrics show cumulative count of Article Views (full-text article views including HTML views, PDF and ePub downloads, according to the available data) and Abstracts Views on Vision4Press platform.
Data correspond to usage on the plateform after 2015. The current usage metrics is available 48-96 hours after online publication and is updated daily on week days.
Initial download of the metrics may take a while.