Fig. 3
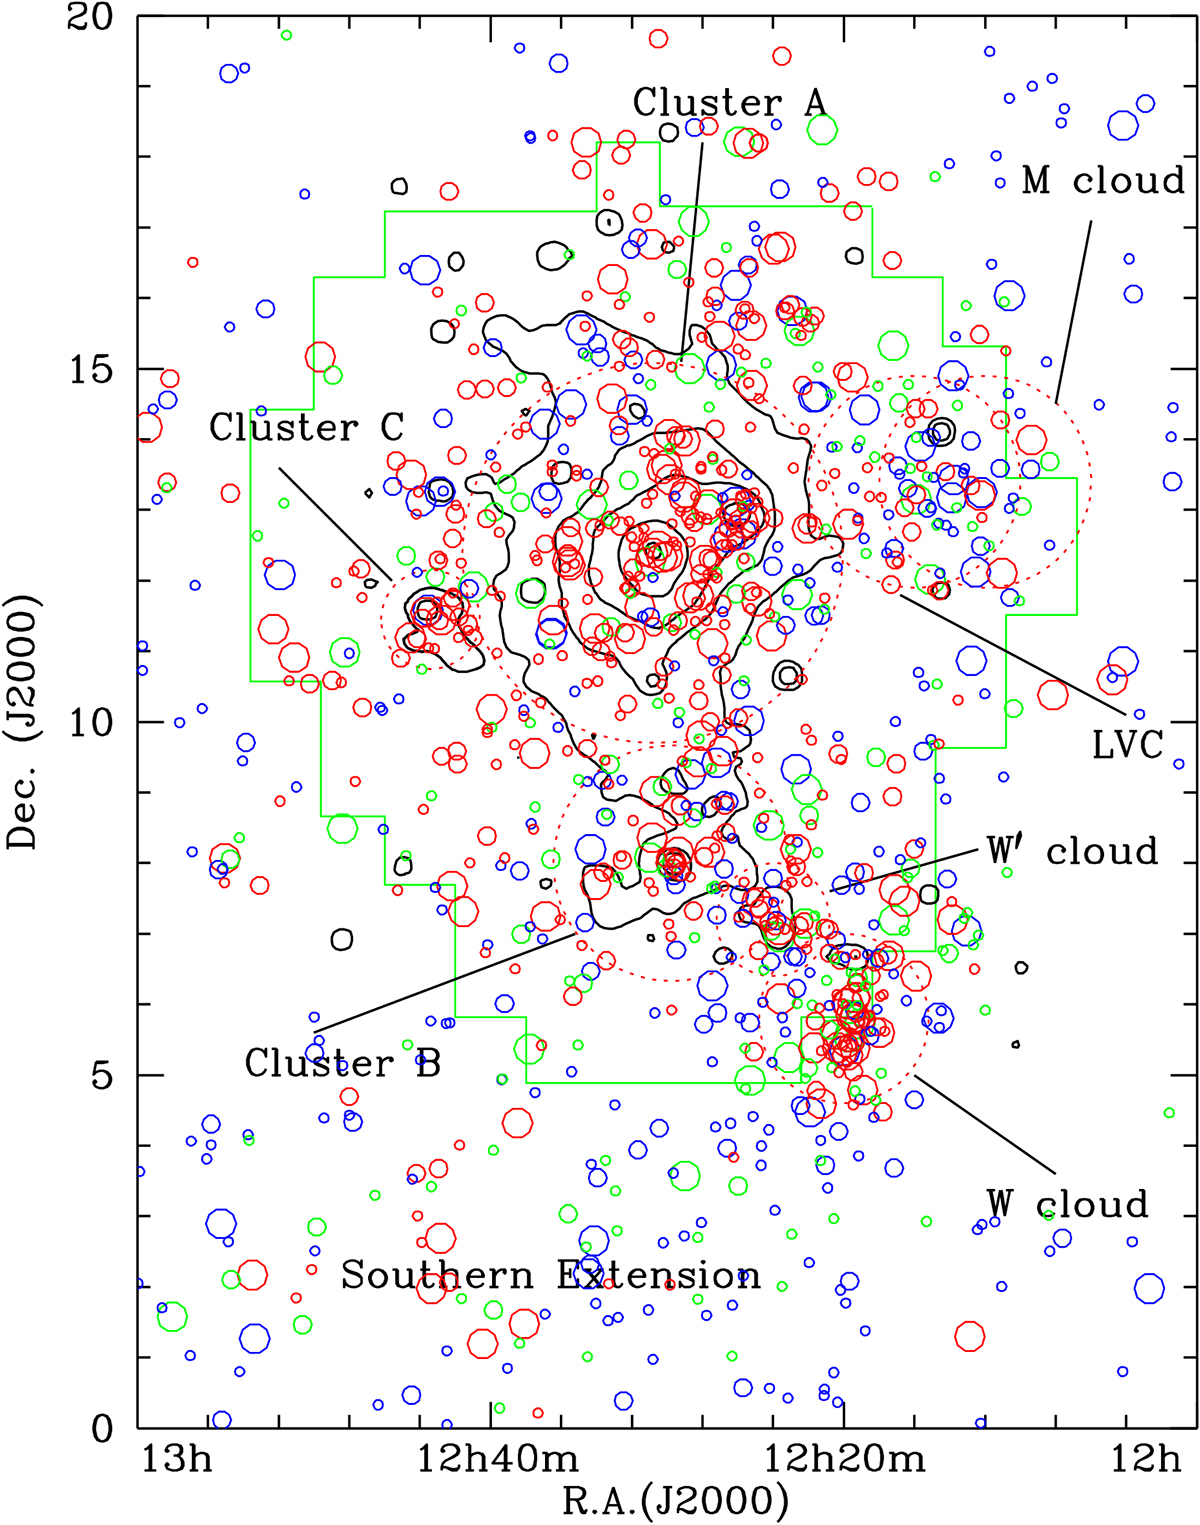
Virgo cluster region mapped by VESTIGE. The complete blind survey covers the inner 104 deg2 (green footprint), the same region mapped by NGVS (Ferrarese et al. 2012). The black contours indicate the X-ray emission of the diffuse gas of the cluster obtained by ROSAT (Böhringer et al. 1994), the large red dotted circles indicate the different substructures of the cluster, while the red, green, and blue empty circles indicate early-type galaxies, transition type galaxies, and star-forming systems, respectively, with sizes depending on their stellar mass (big for Mstar > 109.5 M⊙, medium for 108.5 <Mstar ≤ 109.5 M⊙, small for Mstar ≤ 108.5 M⊙) as defined in Boselli et al. (2014a).
Current usage metrics show cumulative count of Article Views (full-text article views including HTML views, PDF and ePub downloads, according to the available data) and Abstracts Views on Vision4Press platform.
Data correspond to usage on the plateform after 2015. The current usage metrics is available 48-96 hours after online publication and is updated daily on week days.
Initial download of the metrics may take a while.