Fig. 2
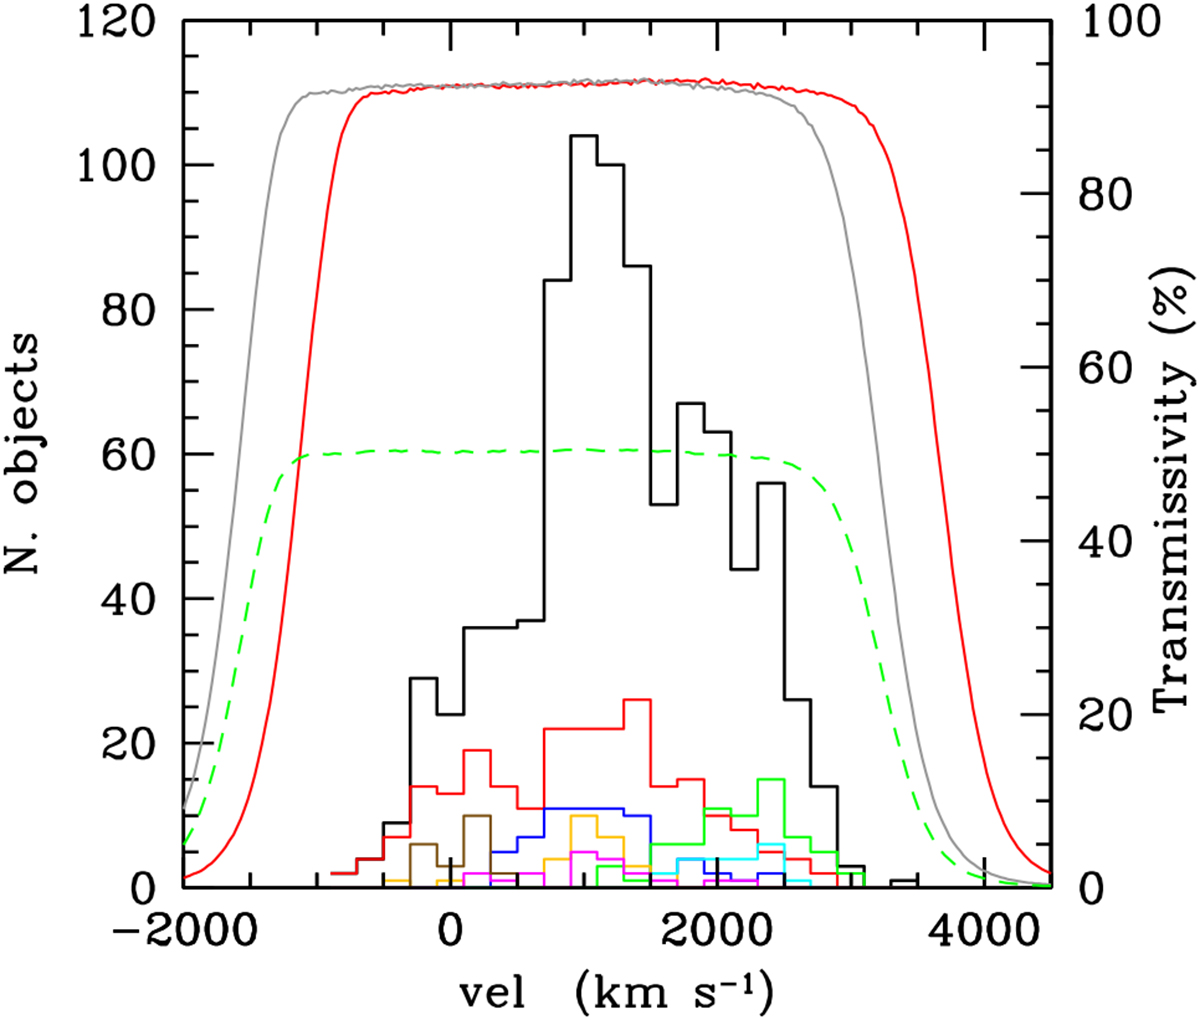
Velocity distribution of galaxies within the VESTIGE footprint (black histogram) is compared to the transmissivity of the Hα NB filter as measured in laboratory (red solid line) or expected for the typical spring observing conditions (T = 0°C; grey solid line). The green dashed line shows the combined transmission for mirrors, optics, filter, and detectors. The velocity distribution of galaxies located within the different subclouds of the cluster defined as in Boselli et al. (2014a) are given with the coloured histograms: red – cluster A, blue – cluster B, green – W cloud, orange – W′ cloud, cyan – M cloud, magenta – cluster C, brown – low velocity cloud.
Current usage metrics show cumulative count of Article Views (full-text article views including HTML views, PDF and ePub downloads, according to the available data) and Abstracts Views on Vision4Press platform.
Data correspond to usage on the plateform after 2015. The current usage metrics is available 48-96 hours after online publication and is updated daily on week days.
Initial download of the metrics may take a while.