Fig. 17
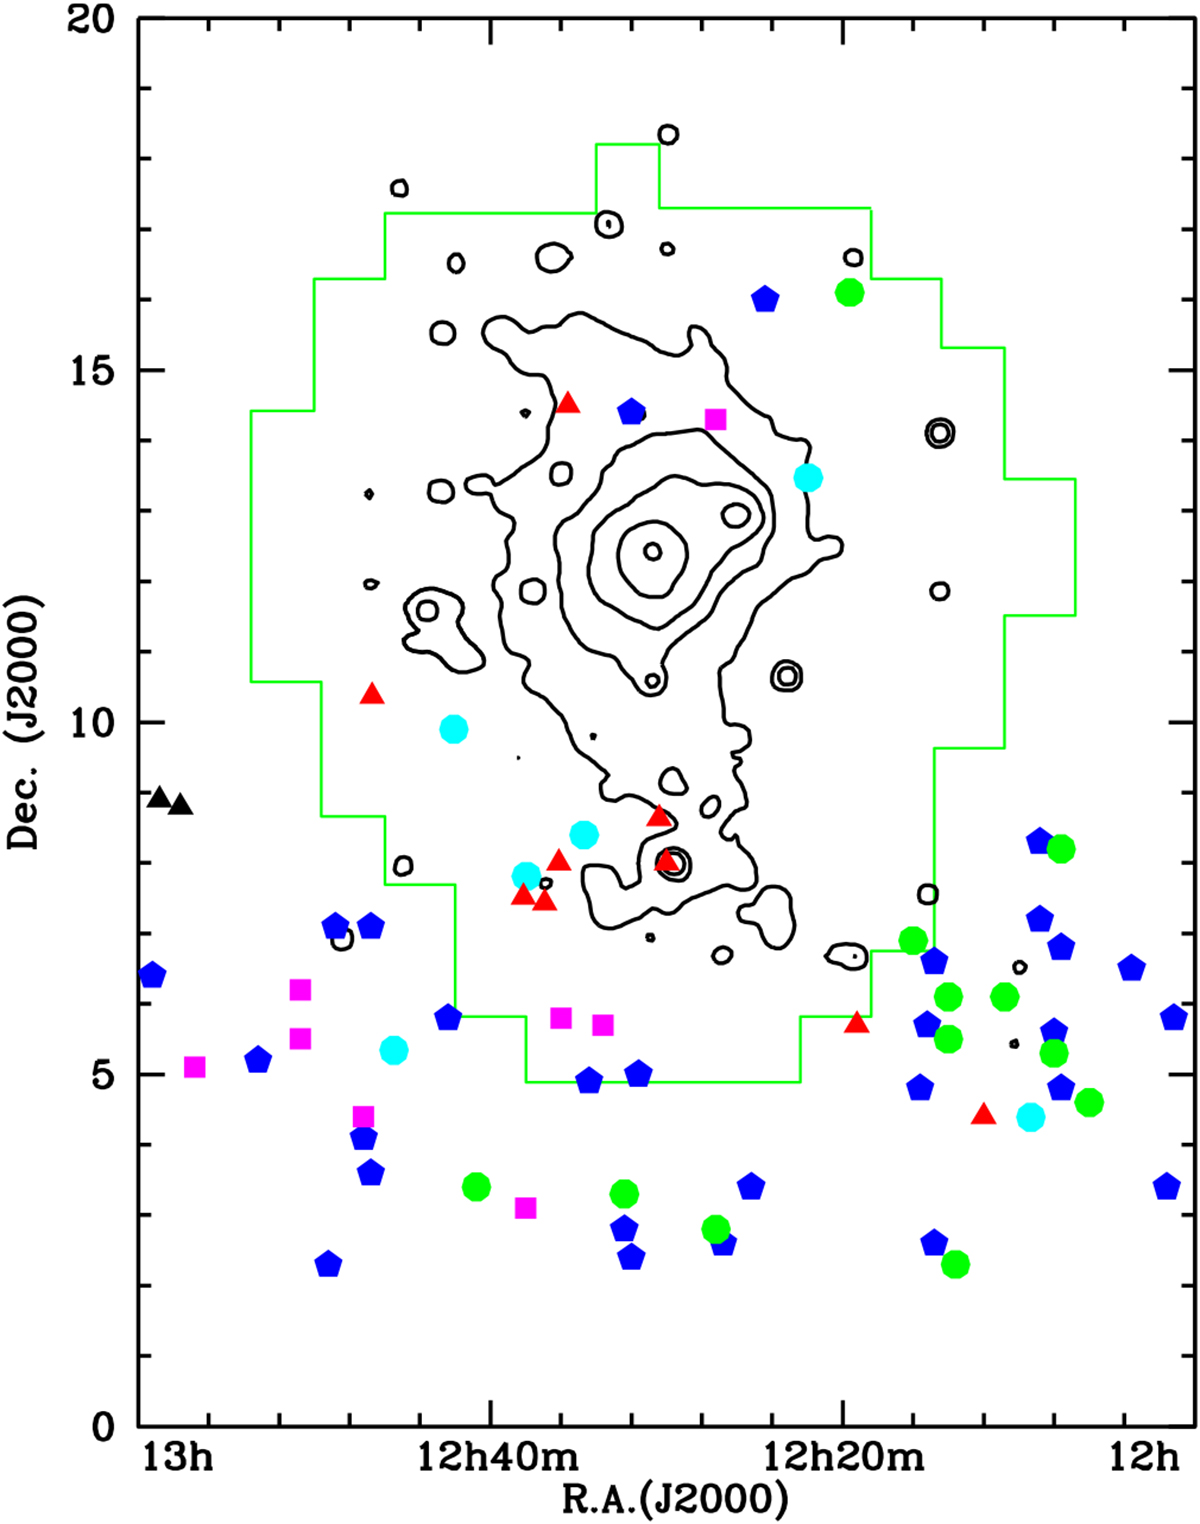
Distribution of the HI compact sources detected by GALFA-HI and ALFALFA within the Virgo cluster region mapped by VESTIGE. The green footprint indicates the blind mapped region of the survey. The black contours show the X-ray emitting hot gas distribution within the cluster. Black filled triangles are HVC, red filled triangles galaxy candidates and dark galaxies (see Sect. 7.1.7), blue filled pentagons cold LVC, magenta filled squares warm LVC, green filled dots warm positive LVC (from Saul et al. 2012), while cyan filled dots UCHVC, from Adams et al. (2013).
Current usage metrics show cumulative count of Article Views (full-text article views including HTML views, PDF and ePub downloads, according to the available data) and Abstracts Views on Vision4Press platform.
Data correspond to usage on the plateform after 2015. The current usage metrics is available 48-96 hours after online publication and is updated daily on week days.
Initial download of the metrics may take a while.