Fig. 7
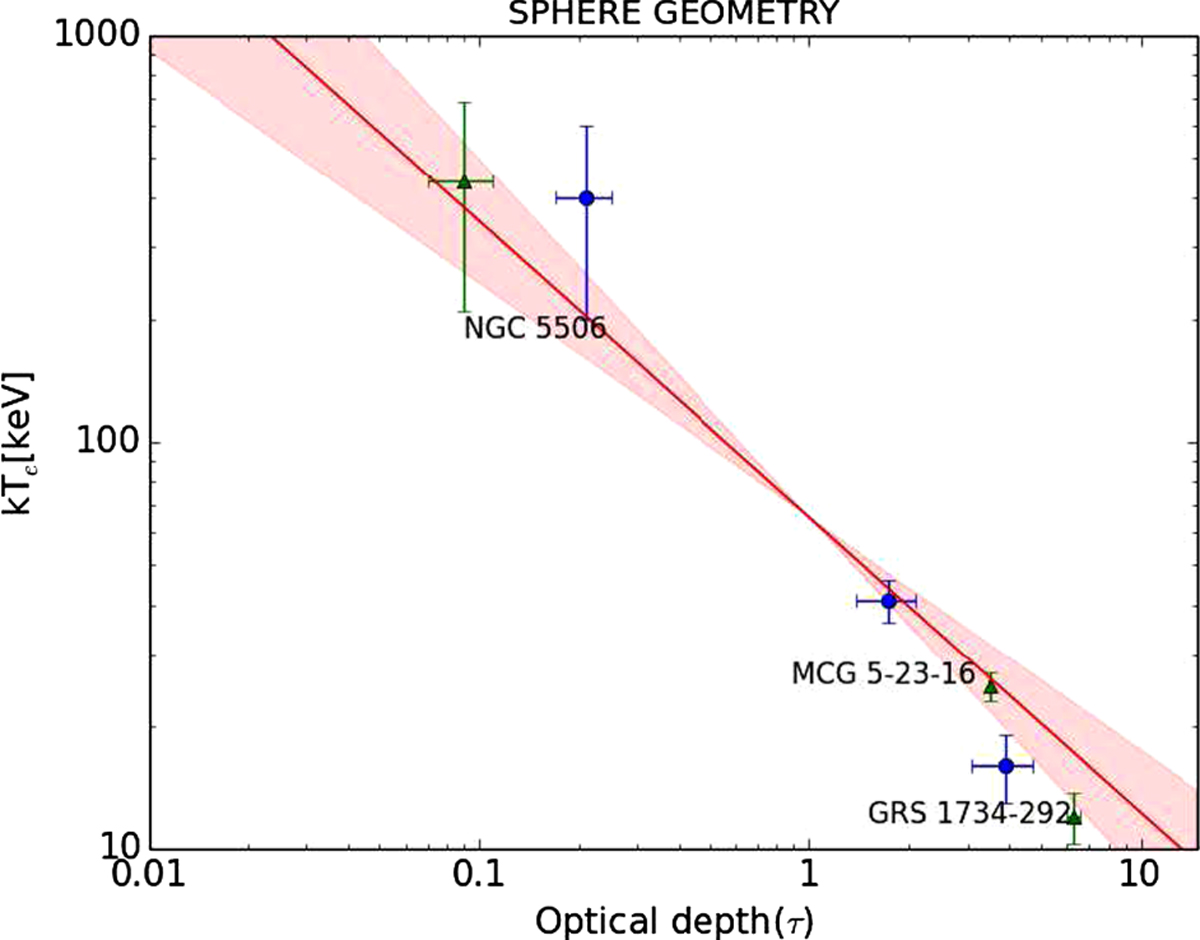
Optical depth vs electron coronal temperature in the case of a spherical corona for GRS 1734-292, NGC 5506, and MCG-05-23-16 (blue circles) and the values obtained with our reanalysis (green triangle); see Appendix A. We superimposed the fit (red line) and the error on the fitting relation (red shaded region) obtained with all the literature values for all the sources, as in the lower panel of Fig. 6.
Current usage metrics show cumulative count of Article Views (full-text article views including HTML views, PDF and ePub downloads, according to the available data) and Abstracts Views on Vision4Press platform.
Data correspond to usage on the plateform after 2015. The current usage metrics is available 48-96 hours after online publication and is updated daily on week days.
Initial download of the metrics may take a while.