Fig. 2
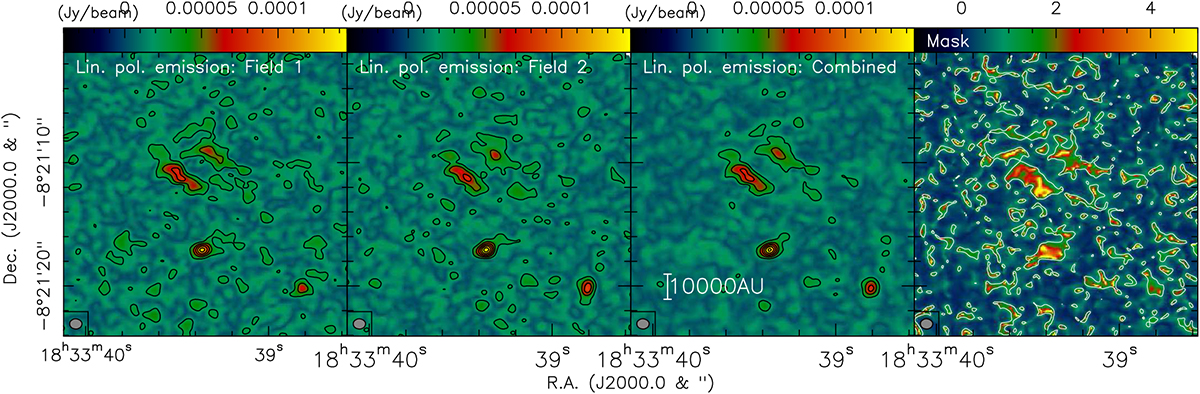
Comparison of the images of the two fields, shown both individually and then combined. The left panel shows the linearly polarized emission using only field 1, the second panel presents the same emission but using only field 2, and the third panel shows the combined image. The contour levels are always chosen as the 4σ levels of the combined image where 1σ is 6 μJy beam−1. The right panel presents the mask created from the combined image and the residuals of each individual image following Matthews et al. (2014); see Sect. 2. The contour level is set to 1, corresponding to the 3σ confidence level in Matthews et al. (2014). The beam sizes are shown at the bottom-left of each panel, and the combined image also shows a scale bar.
Current usage metrics show cumulative count of Article Views (full-text article views including HTML views, PDF and ePub downloads, according to the available data) and Abstracts Views on Vision4Press platform.
Data correspond to usage on the plateform after 2015. The current usage metrics is available 48-96 hours after online publication and is updated daily on week days.
Initial download of the metrics may take a while.