Fig. 1
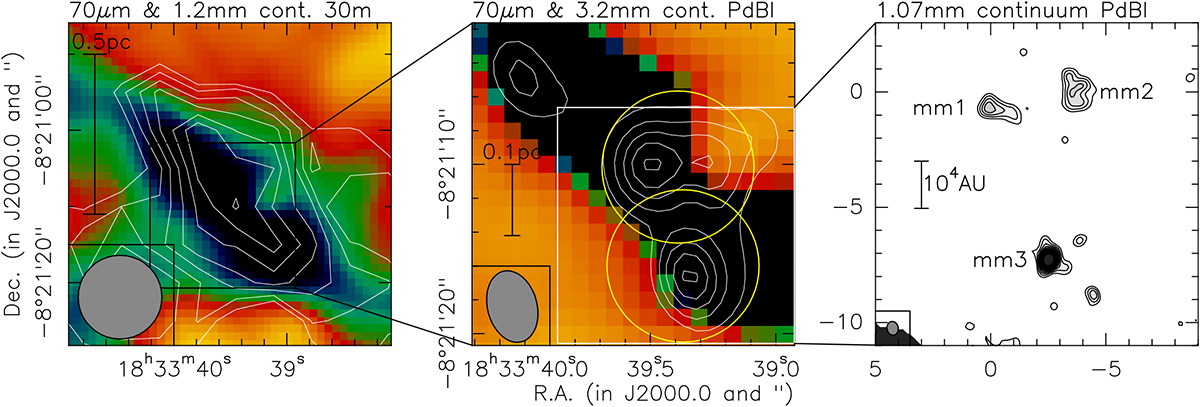
Compilation of the continuum images in IRDC 18310-4 (Beuther et al. 2013, 2015). The left and middle panels show in colorthe Herschel 70 μm image with a stretch going dark for low values. The white contours in the left panel show the 1.2 mm MAMBO continuum observationsstarting from 4σ and continuing in steps of 1σ, with 1σ being equal to 13 mJy beam−1. The contours in the middle panel presents the 3.2 mm PdBI continuum data starting from 3σ and continuing in steps of 2σ, with 1σ equal to 0.08 mJy beam−1. The two yellow circles outline the ~9″ inner third of the two pointings (field 1 north, field 2 south) we observed in this polarization project. The right panel then shows the 1.07 mm PdBI continuum observations starting from 3σ and continuing in steps of 1σ with 1σ equal to 0.6 mJy beam−1.
Current usage metrics show cumulative count of Article Views (full-text article views including HTML views, PDF and ePub downloads, according to the available data) and Abstracts Views on Vision4Press platform.
Data correspond to usage on the plateform after 2015. The current usage metrics is available 48-96 hours after online publication and is updated daily on week days.
Initial download of the metrics may take a while.