Fig. 4
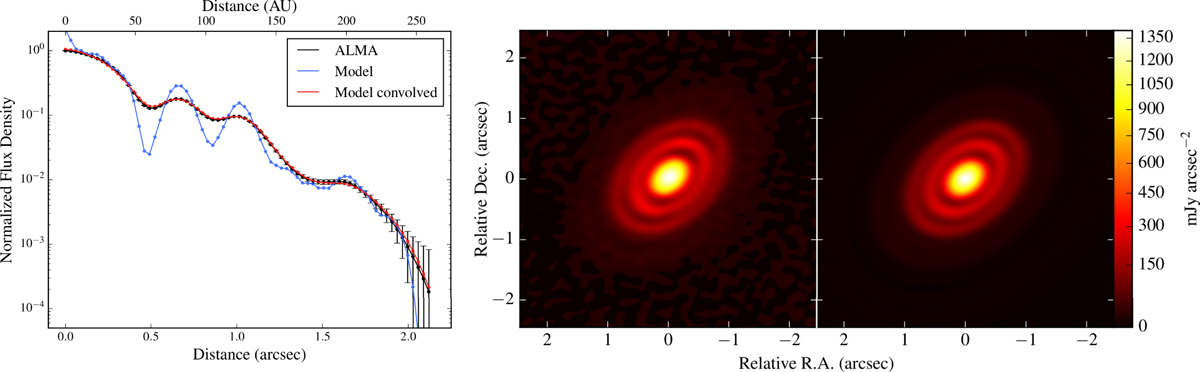
Left panel: radial profiles of the ALMA image (black), ray-traced model image (blue), and ray-traced model image after convolution with a 2-dimensional Gaussian kernel with dimensions of 0.22 arcsec by 0.15 arcsec and a PA of –88° (green). Each point was obtained by integrating the flux density in elliptical annuli of varying radii and normalizing first by the aperture area, and then by the maximum of the ALMA image profile. The error bars for the ALMA profile were obtained as the rms of the image divided by the number of synthesized beams contained in each annuli. Right panel: side-by-side comparison of the ALMA image (left) and the ray-traced image of one of our models (right) after Gaussian blurring.
Current usage metrics show cumulative count of Article Views (full-text article views including HTML views, PDF and ePub downloads, according to the available data) and Abstracts Views on Vision4Press platform.
Data correspond to usage on the plateform after 2015. The current usage metrics is available 48-96 hours after online publication and is updated daily on week days.
Initial download of the metrics may take a while.