Fig. 2
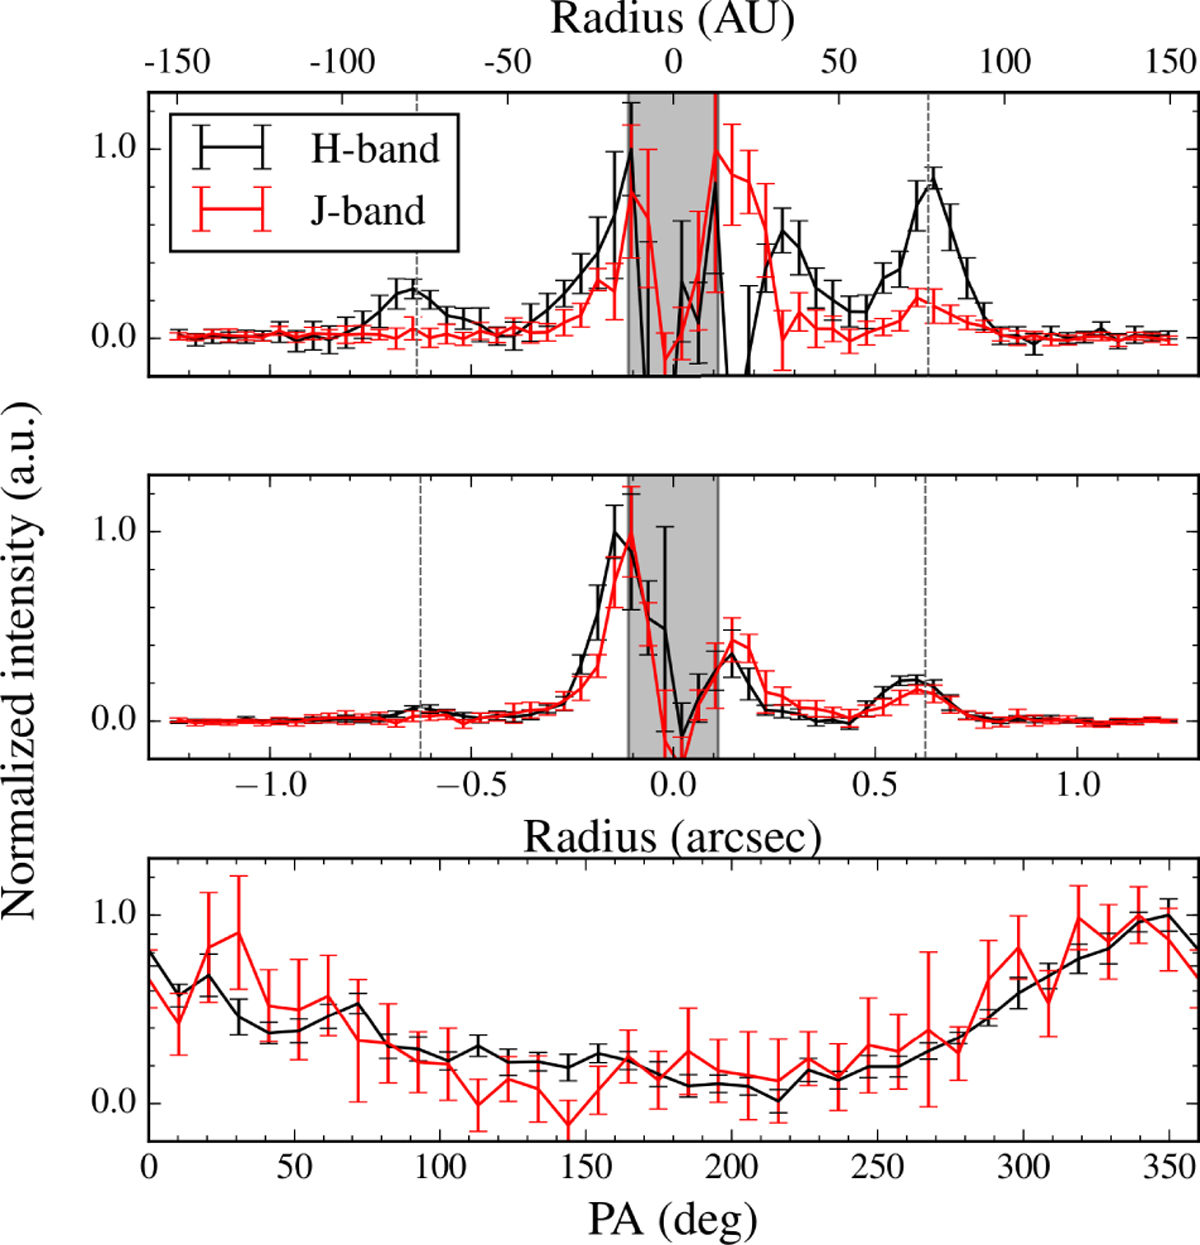
Top panel: radial polarized intensity profile through the center of the ring along the major axis for H-band (black) and J-band (red) Qϕ images. Middle panel: radial polarized intensity profile through the star in the direction of the major axis for both bands. Positive radii correspond to the northwest direction, and negative radii to the southeast direction. The vertical dashed lines indicate the approximate location of the ring at 77 AU. The gray region at the center of the figure corresponds to the location of the coronograph. Bottom panel: azimuthal intensity profile of the ring in the H band (black)and J band (red) at a distance of 77 and 74 AU from the center of the disk, respectively, centered at the center of each ring. The position angle PA is measured east from north. All profiles are normalized to the maximum intensity.
Current usage metrics show cumulative count of Article Views (full-text article views including HTML views, PDF and ePub downloads, according to the available data) and Abstracts Views on Vision4Press platform.
Data correspond to usage on the plateform after 2015. The current usage metrics is available 48-96 hours after online publication and is updated daily on week days.
Initial download of the metrics may take a while.