Fig. 10
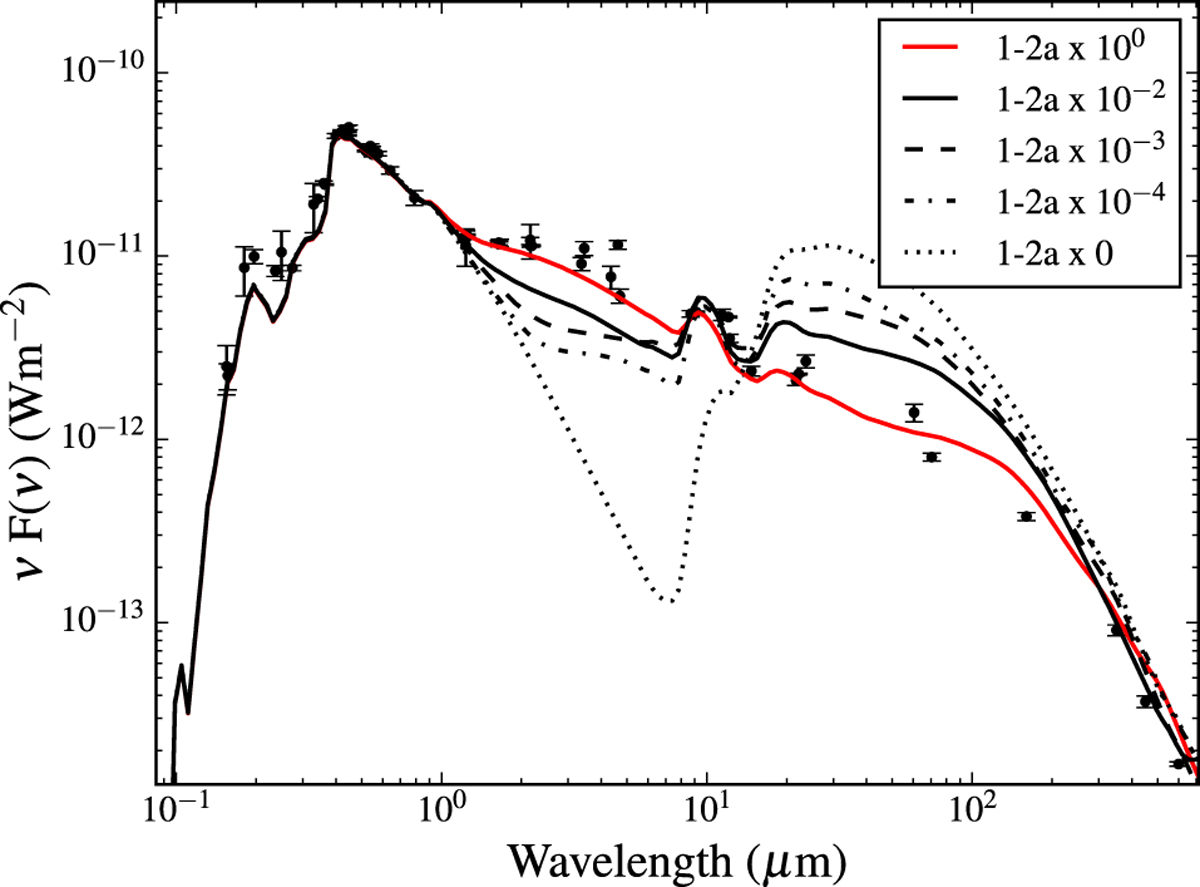
Spectral energy distribution of HD 163296. The points and their corresponding error bars correspond to the photometry of the source. The total SED of model M2 is shown as a thick solid red line. The solid, dashed, dot-dashed, and dotted black lines show the SEDs obtained by depleting zones 1 and 2a of the model by a factor 102, 103, 104, and complete depletion, respectively.
Current usage metrics show cumulative count of Article Views (full-text article views including HTML views, PDF and ePub downloads, according to the available data) and Abstracts Views on Vision4Press platform.
Data correspond to usage on the plateform after 2015. The current usage metrics is available 48-96 hours after online publication and is updated daily on week days.
Initial download of the metrics may take a while.